
 Yahoo Finance
 Emmi (VTX:EMMN) shareholders have endured a 22% loss from investing in the stock a year ago
Passive investing in an index fund is a good way to ensure your own returns roughly match the overall market. Active investors aim to buy stocks that vastly outperform the market - but in the process, they risk under-performance. That downside risk was realized by Emmi AG (VTX:EMMN) shareholders over the last year, as the share price declined 23%. That's well below the market decline of 15%. Longer term shareholders haven't suffered as badly, since the stock is down a comparatively less painful 2.2% in three years.
With that in mind, it's worth seeing if the company's underlying fundamentals have been the driver of long term performance, or if there are some discrepancies.
See our latest analysis for Emmi
While markets are a powerful pricing mechanism, share prices reflect investor sentiment, not just underlying business performance. One way to examine how market sentiment has changed over time is to look at the interaction between a company's share price and its earnings per share (EPS).
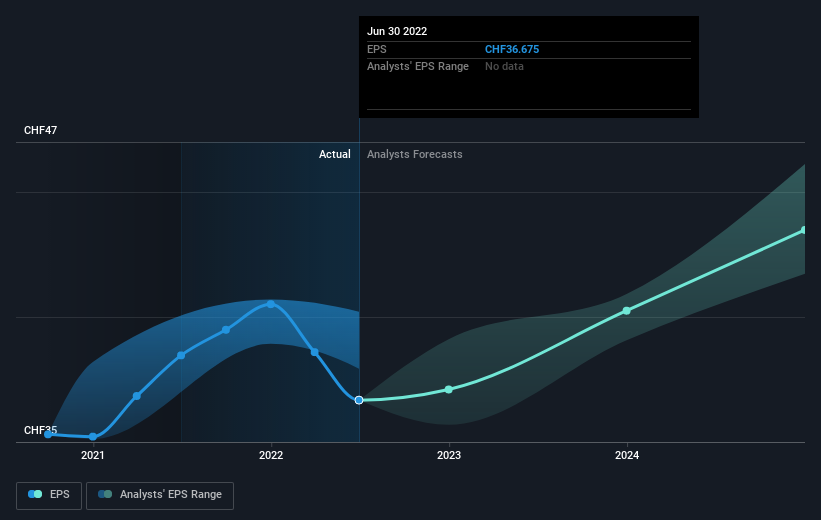
Unhappily, Emmi had to report a 4.7% decline in EPS over the last year. This reduction in EPS is not as bad as the 23% share price fall. Unsurprisingly, given the lack of EPS growth, the market seems to be more cautious about the stock.
The company's earnings per share (over time) is depicted in the image below (click to see the exact numbers).
Before buying or selling a stock, we always recommend a close examination of historic growth trends, available here.
A Different Perspective
While the broader market lost about 15% in the twelve months, Emmi shareholders did even worse, losing 22% (even including dividends). Having said that, it's inevitable that some stocks will be oversold in a falling market. The key is to keep your eyes on the fundamental developments. Longer term investors wouldn't be so upset, since they would have made 4%, each year, over five years. It could be that the recent sell-off is an opportunity, so it may be worth checking the fundamental data for signs of a long term growth trend. It's always interesting to track share price performance over the longer term. But to understand Emmi better, we need to consider many other factors. Take risks, for example - Emmi has 1 warning sign we think you should be aware of.
If you would prefer to check out another company -- one with potentially superior financials -- then do not miss this free list of companies that have proven they can grow earnings.
Please note, the market returns quoted in this article reflect the market weighted average returns of stocks that currently trade on CH exchanges.
Have feedback on this article? Concerned about the content? Get in touch with us directly. Alternatively, email editorial-team (at) simplywallst.com.
This article by Simply Wall St is general in nature. We provide commentary based on historical data and analyst forecasts only using an unbiased methodology and our articles are not intended to be financial advice. It does not constitute a recommendation to buy or sell any stock, and does not take account of your objectives, or your financial situation. We aim to bring you long-term focused analysis driven by fundamental data. Note that our analysis may not factor in the latest price-sensitive company announcements or qualitative material. Simply Wall St has no position in any stocks mentioned.
Join A Paid User Research Session
You’ll receive a US$30 Amazon Gift card for 1 hour of your time while helping us build better investing tools for the individual investors like yourself. Sign up here
