
 Yahoo Finance
 Is ENGIE SA's (EPA:ENGI) High P/E Ratio A Problem For Investors?

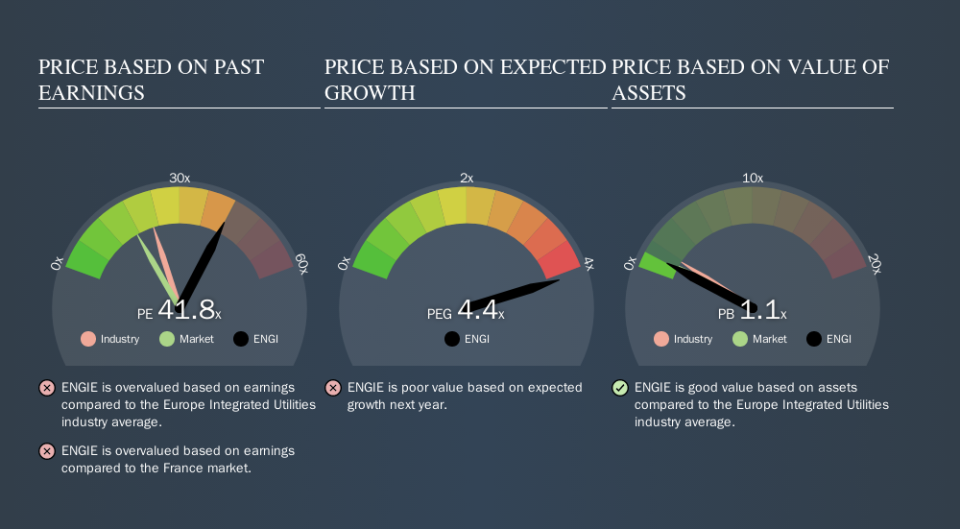
This article is for investors who would like to improve their understanding of price to earnings ratios (P/E ratios). We'll look at ENGIE SA's (EPA:ENGI) P/E ratio and reflect on what it tells us about the company's share price. ENGIE has a P/E ratio of 41.81, based on the last twelve months. In other words, at today's prices, investors are paying €41.81 for every €1 in prior year profit.
View our latest analysis for ENGIE
How Do You Calculate ENGIE's P/E Ratio?
The formula for price to earnings is:
Price to Earnings Ratio = Price per Share ÷ Earnings per Share (EPS)
Or for ENGIE:
P/E of 41.81 = €14.96 ÷ €0.36 (Based on the trailing twelve months to June 2019.)
Is A High Price-to-Earnings Ratio Good?
A higher P/E ratio means that investors are paying a higher price for each €1 of company earnings. That isn't a good or a bad thing on its own, but a high P/E means that buyers have a higher opinion of the business's prospects, relative to stocks with a lower P/E.
How Does ENGIE's P/E Ratio Compare To Its Peers?
The P/E ratio essentially measures market expectations of a company. As you can see below, ENGIE has a higher P/E than the average company (22.3) in the integrated utilities industry.
Its relatively high P/E ratio indicates that ENGIE shareholders think it will perform better than other companies in its industry classification. Clearly the market expects growth, but it isn't guaranteed. So investors should always consider the P/E ratio alongside other factors, such as whether company directors have been buying shares.
How Growth Rates Impact P/E Ratios
Probably the most important factor in determining what P/E a company trades on is the earnings growth. Earnings growth means that in the future the 'E' will be higher. And in that case, the P/E ratio itself will drop rather quickly. Then, a lower P/E should attract more buyers, pushing the share price up.
ENGIE shrunk earnings per share by 9.8% last year.
A Limitation: P/E Ratios Ignore Debt and Cash In The Bank
One drawback of using a P/E ratio is that it considers market capitalization, but not the balance sheet. That means it doesn't take debt or cash into account. Hypothetically, a company could reduce its future P/E ratio by spending its cash (or taking on debt) to achieve higher earnings.
Such expenditure might be good or bad, in the long term, but the point here is that the balance sheet is not reflected by this ratio.
So What Does ENGIE's Balance Sheet Tell Us?
ENGIE has net debt worth 67% of its market capitalization. If you want to compare its P/E ratio to other companies, you should absolutely keep in mind it has significant borrowings.
The Bottom Line On ENGIE's P/E Ratio
ENGIE has a P/E of 41.8. That's higher than the average in its market, which is 17.3. With significant debt and no EPS growth last year, shareholders are betting on an improvement in earnings from the company.
Investors have an opportunity when market expectations about a stock are wrong. If the reality for a company is better than it expects, you can make money by buying and holding for the long term. So this free visual report on analyst forecasts could hold the key to an excellent investment decision.
Of course, you might find a fantastic investment by looking at a few good candidates. So take a peek at this free list of companies with modest (or no) debt, trading on a P/E below 20.
We aim to bring you long-term focused research analysis driven by fundamental data. Note that our analysis may not factor in the latest price-sensitive company announcements or qualitative material.
If you spot an error that warrants correction, please contact the editor at editorial-team@simplywallst.com. This article by Simply Wall St is general in nature. It does not constitute a recommendation to buy or sell any stock, and does not take account of your objectives, or your financial situation. Simply Wall St has no position in the stocks mentioned. Thank you for reading.
