
 Yahoo Finance
 Is Entertainment One Ltd. (LON:ETO) A Financially Sound Company?

Small-cap and large-cap companies receive a lot of attention from investors, but mid-cap stocks like Entertainment One Ltd. (LON:ETO), with a market cap of UK£1.7b, are often out of the spotlight. While they are less talked about as an investment category, mid-cap risk-adjusted returns have generally been better than more commonly focused stocks that fall into the small- or large-cap categories. This article will examine ETO’s financial liquidity and debt levels to get an idea of whether the company can deal with cyclical downturns and maintain funds to accommodate strategic spending for future growth. Note that this information is centred entirely on financial health and is a top-level understanding, so I encourage you to look further into ETO here.
Check out our latest analysis for Entertainment One
How does ETO’s operating cash flow stack up against its debt?
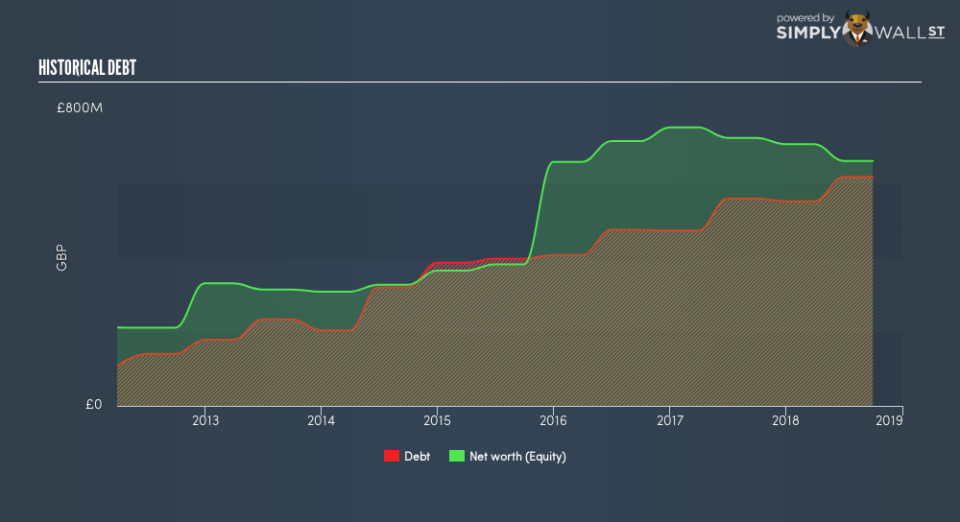
Over the past year, ETO has ramped up its debt from UK£559m to UK£617m , which accounts for long term debt. With this rise in debt, the current cash and short-term investment levels stands at UK£112m for investing into the business. Additionally, ETO has generated cash from operations of UK£65m over the same time period, leading to an operating cash to total debt ratio of 10%, meaning that ETO’s debt is not appropriately covered by operating cash. This ratio can also be a sign of operational efficiency as an alternative to return on assets. In ETO’s case, it is able to generate 0.1x cash from its debt capital.
Can ETO meet its short-term obligations with the cash in hand?
Looking at ETO’s UK£550m in current liabilities, it appears that the company has been able to meet these commitments with a current assets level of UK£835m, leading to a 1.52x current account ratio. For Entertainment companies, this ratio is within a sensible range as there’s enough of a cash buffer without holding too much capital in low return investments.
Is ETO’s debt level acceptable?
With debt reaching 93% of equity, ETO may be thought of as relatively highly levered. This is not uncommon for a mid-cap company given that debt tends to be lower-cost and at times, more accessible. We can test if ETO’s debt levels are sustainable by measuring interest payments against earnings of a company. Ideally, earnings before interest and tax (EBIT) should cover net interest by at least three times. For ETO, the ratio of 1.96x suggests that interest is not strongly covered, which means that lenders may be more reluctant to lend out more funding as ETO’s low interest coverage already puts the company at higher risk of default.
Next Steps:
Although ETO’s debt level is towards the higher end of the spectrum, its cash flow coverage seems adequate to meet obligations which means its debt is being efficiently utilised. Since there is also no concerns around ETO’s liquidity needs, this may be its optimal capital structure for the time being. This is only a rough assessment of financial health, and I’m sure ETO has company-specific issues impacting its capital structure decisions. You should continue to research Entertainment One to get a better picture of the mid-cap by looking at:
Future Outlook: What are well-informed industry analysts predicting for ETO’s future growth? Take a look at our free research report of analyst consensus for ETO’s outlook.
Valuation: What is ETO worth today? Is the stock undervalued, even when its growth outlook is factored into its intrinsic value? The intrinsic value infographic in our free research report helps visualize whether ETO is currently mispriced by the market.
Other High-Performing Stocks: Are there other stocks that provide better prospects with proven track records? Explore our free list of these great stocks here.
To help readers see past the short term volatility of the financial market, we aim to bring you a long-term focused research analysis purely driven by fundamental data. Note that our analysis does not factor in the latest price-sensitive company announcements.
The author is an independent contributor and at the time of publication had no position in the stocks mentioned. For errors that warrant correction please contact the editor at editorial-team@simplywallst.com.
