
 Yahoo Finance
 With EPS Growth And More, FSA Group (ASX:FSA) Is Interesting
Some have more dollars than sense, they say, so even companies that have no revenue, no profit, and a record of falling short, can easily find investors. But the reality is that when a company loses money each year, for long enough, its investors will usually take their share of those losses.
In the age of tech-stock blue-sky investing, my choice may seem old fashioned; I still prefer profitable companies like FSA Group (ASX:FSA). While that doesn't make the shares worth buying at any price, you can't deny that successful capitalism requires profit, eventually. In comparison, loss making companies act like a sponge for capital - but unlike such a sponge they do not always produce something when squeezed.
View our latest analysis for FSA Group
How Fast Is FSA Group Growing?
If you believe that markets are even vaguely efficient, then over the long term you'd expect a company's share price to follow its earnings per share (EPS). That means EPS growth is considered a real positive by most successful long-term investors. Over the last three years, FSA Group has grown EPS by 17% per year. That growth rate is fairly good, assuming the company can keep it up.
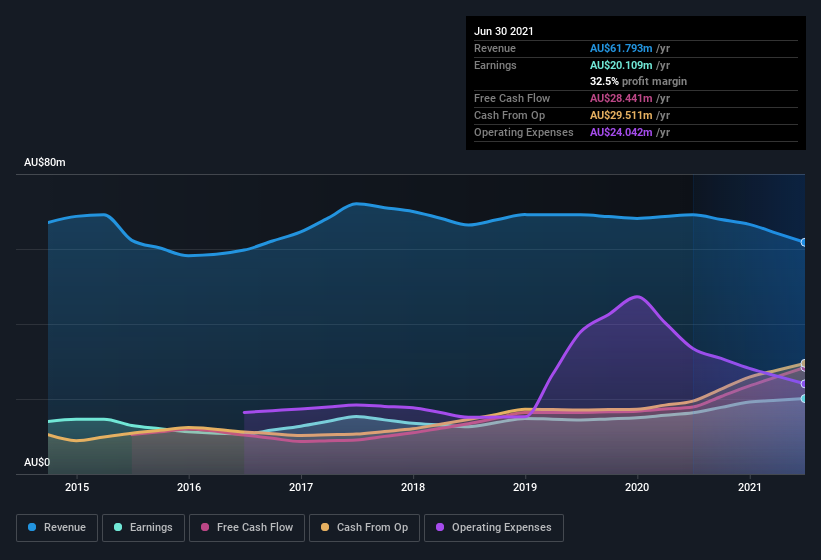
Careful consideration of revenue growth and earnings before interest and taxation (EBIT) margins can help inform a view on the sustainability of the recent profit growth. I note that FSA Group's revenue from operations was lower than its revenue in the last twelve months, so that could distort my analysis of its margins. FSA Group's EBIT margins are flat but, of some concern, its revenue is actually down. And that does make me a little more cautious of the stock.
In the chart below, you can see how the company has grown earnings, and revenue, over time. For finer detail, click on the image.
Since FSA Group is no giant, with a market capitalization of AU$137m, so you should definitely check its cash and debt before getting too excited about its prospects.
Are FSA Group Insiders Aligned With All Shareholders?
It makes me feel more secure owning shares in a company if insiders also own shares, thusly more closely aligning our interests. As a result, I'm encouraged by the fact that insiders own FSA Group shares worth a considerable sum. To be specific, they have AU$47m worth of shares. That's a lot of money, and no small incentive to work hard. Those holdings account for over 34% of the company; visible skin in the game.
Does FSA Group Deserve A Spot On Your Watchlist?
One important encouraging feature of FSA Group is that it is growing profits. If that's not enough on its own, there is also the rather notable levels of insider ownership. That combination appeals to me, for one. So yes, I do think the stock is worth keeping an eye on. Before you take the next step you should know about the 2 warning signs for FSA Group (1 can't be ignored!) that we have uncovered.
Although FSA Group certainly looks good to me, I would like it more if insiders were buying up shares. If you like to see insider buying, too, then this free list of growing companies that insiders are buying, could be exactly what you're looking for.
Please note the insider transactions discussed in this article refer to reportable transactions in the relevant jurisdiction.
This article by Simply Wall St is general in nature. We provide commentary based on historical data and analyst forecasts only using an unbiased methodology and our articles are not intended to be financial advice. It does not constitute a recommendation to buy or sell any stock, and does not take account of your objectives, or your financial situation. We aim to bring you long-term focused analysis driven by fundamental data. Note that our analysis may not factor in the latest price-sensitive company announcements or qualitative material. Simply Wall St has no position in any stocks mentioned.
Have feedback on this article? Concerned about the content? Get in touch with us directly. Alternatively, email editorial-team (at) simplywallst.com.
