
 Yahoo Finance
 Is Epwin Group PLC’s (LON:EPWN) Balance Sheet Strong Enough To Weather A Storm?

Epwin Group PLC (LON:EPWN) is a small-cap stock with a market capitalization of UK£98m. While investors primarily focus on the growth potential and competitive landscape of the small-cap companies, they end up ignoring a key aspect, which could be the biggest threat to its existence: its financial health. Why is it important? Evaluating financial health as part of your investment thesis is essential, as mismanagement of capital can lead to bankruptcies, which occur at a higher rate for small-caps. The following basic checks can help you get a picture of the company’s balance sheet strength. However, potential investors would need to take a closer look, and I recommend you dig deeper yourself into EPWN here.
Does EPWN Produce Much Cash Relative To Its Debt?
Over the past year, EPWN has maintained its debt levels at around UK£34m including long-term debt. At this stable level of debt, the current cash and short-term investment levels stands at UK£5.8m , ready to be used for running the business. On top of this, EPWN has generated UK£20m in operating cash flow during the same period of time, resulting in an operating cash to total debt ratio of 58%, meaning that EPWN’s debt is appropriately covered by operating cash.
Can EPWN pay its short-term liabilities?
Looking at EPWN’s UK£94m in current liabilities, it appears that the company may not be able to easily meet these obligations given the level of current assets of UK£83m, with a current ratio of 0.88x. The current ratio is calculated by dividing current assets by current liabilities.
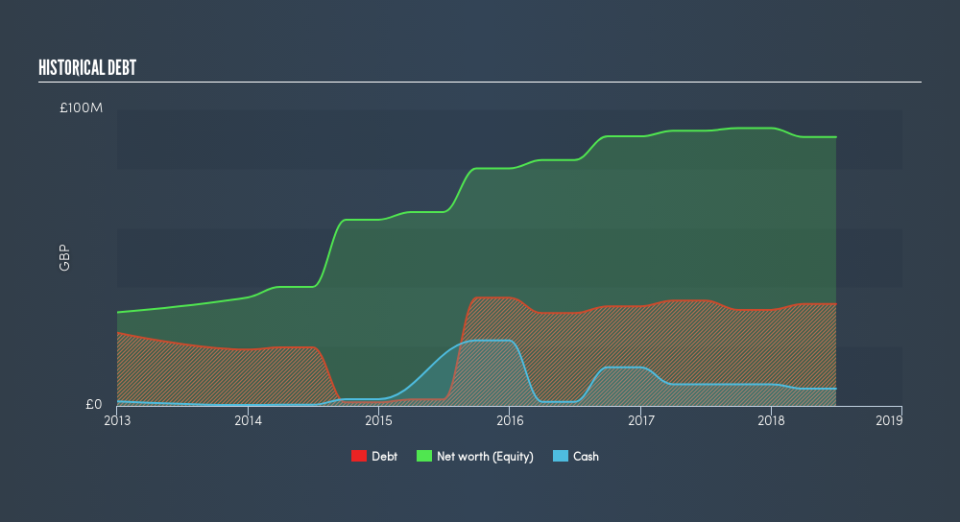
Does EPWN face the risk of succumbing to its debt-load?
With debt at 38% of equity, EPWN may be thought of as appropriately levered. EPWN is not taking on too much debt commitment, which may be constraining for future growth. We can check to see whether EPWN is able to meet its debt obligations by looking at the net interest coverage ratio. A company generating earnings before interest and tax (EBIT) at least three times its net interest payments is considered financially sound. In EPWN’s, case, the ratio of 8.62x suggests that interest is appropriately covered, which means that lenders may be willing to lend out more funding as EPWN’s high interest coverage is seen as responsible and safe practice.
Next Steps:
EPWN’s debt level is appropriate for a company its size. Furthermore, it is able to generate sufficient cash flow coverage, meaning it is able to put its debt in good use. Though its low liquidity raises concerns over whether current asset management practices are properly implemented for the small-cap. I admit this is a fairly basic analysis for EPWN’s financial health. Other important fundamentals need to be considered alongside. I suggest you continue to research Epwin Group to get a more holistic view of the stock by looking at:
Future Outlook: What are well-informed industry analysts predicting for EPWN’s future growth? Take a look at our free research report of analyst consensus for EPWN’s outlook.
Valuation: What is EPWN worth today? Is the stock undervalued, even when its growth outlook is factored into its intrinsic value? The intrinsic value infographic in our free research report helps visualize whether EPWN is currently mispriced by the market.
Other High-Performing Stocks: Are there other stocks that provide better prospects with proven track records? Explore our free list of these great stocks here.
We aim to bring you long-term focused research analysis driven by fundamental data. Note that our analysis may not factor in the latest price-sensitive company announcements or qualitative material.
If you spot an error that warrants correction, please contact the editor at editorial-team@simplywallst.com. This article by Simply Wall St is general in nature. It does not constitute a recommendation to buy or sell any stock, and does not take account of your objectives, or your financial situation. Simply Wall St has no position in the stocks mentioned. Thank you for reading.
