
 Yahoo Finance
 Will the Equity Bull Market Continue?
The old Wall Street adage “buy low and sell high” is one of the most famous adages followed by retail investors. Though buying low and selling high is the ideal situation for investors, savvy investors understand that just because a market has rallied a long way doesn’t mean that the market is due to correct.
Instead of assuming that a certain line of thinking will work without investigating it, investors should make decisions backed by historical data and precedent.
Will the Bull Market Continue?
Historical data may surprise most newer investors. Over the past century, bear markets (which we will define by corrections of 20% or more) have occurred approximately every four years. Meanwhile, the S&P 500 Index averages around a 10% return over the past 50 years.
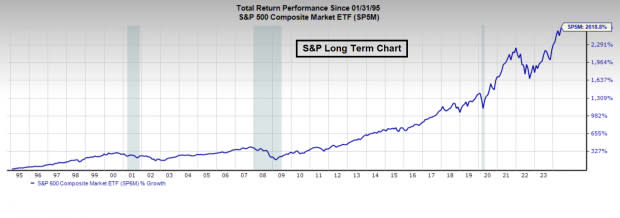
Image Source: Zacks Investment Research
In other words, in the long-term, bulls have the upper hand, and when stocks are trending above the 200-day moving average, investors should be more heavily weighted by long exposure. However, in a shorter time frame, several data metrics point to a bullish continuation in the market.
5 Bullish Catalysts
1. Election Year Seasonality
Historical data indicates that election years outperform the average year in the S&P 500 Index.
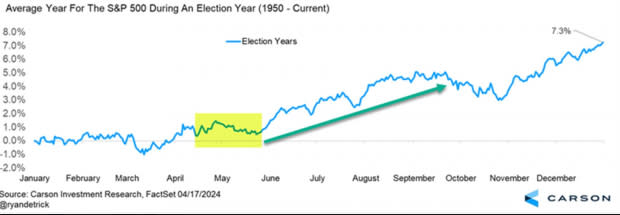
Image Source: Carson Investment Research, Ryan Detrick, FactSet
Furthermore, June, July, and August are the best-performing months within election years (we are off to a strong start in June).
2. Sentiment is Muted
Despite the strong performance in equities in 2024, sentiment among active investors remains muted. The NAAIM (National Association of Active Investment Managers) Exposure index “represents the average exposure to US Equity markets reported by our members.” Currently, the index is at 68.65% long exposure, down from a high of 104.75% in March.
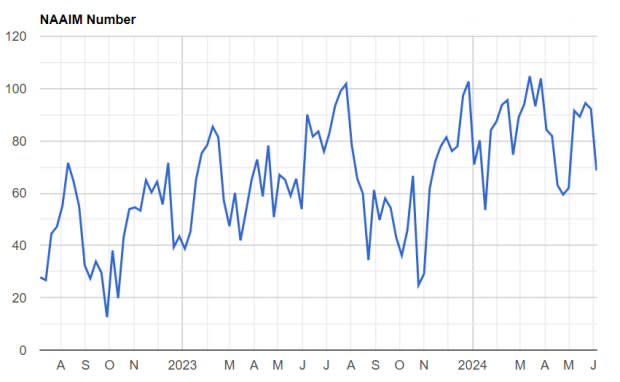
Image Source: NAAIM
3. 52-week Highs are not Bearish
The S&P 500 Index and the Nasdaq recently printed fresh 52-week highs. New 52-week highs in an index mean no bearish overhead supply exists and momentum is likely to continue. Furthermore, the NYSE New Highs-New Lows Index has not recorded two straight days of more new lows than highs in months (a sign of bullish breadth).
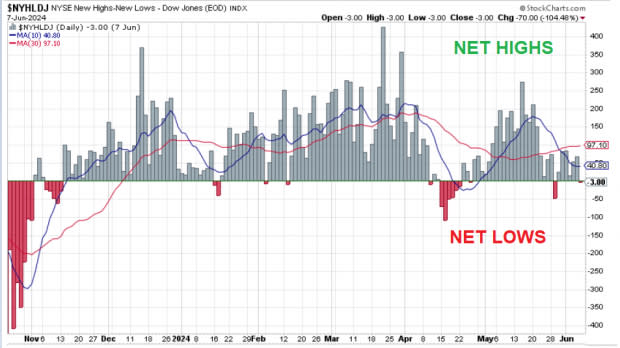
Image Source: StockCharts.com
4. AI Leadership Remains Strong
Bull markets require strong leadership. Undoubtedly, the top industry trend is currently artificial intelligence (AI). Arista Networks (ANET), a high-performance networking hardware and software provider, has a best possible Zacks Rank #1 (Strong Buy). Arm Holdings (ARM), the hottest recent AI IPO, has gained nearly 30% over the past month. Finally, Nvidia (NVDA), the most followed AI-related stock, continues to trend higher and split its stock this morning. Historical data tells us that stocks usually outperform the S&P 500 one year after splitting. If historical norms play out after Nvidia’s split, it’s good news for the tech sector.
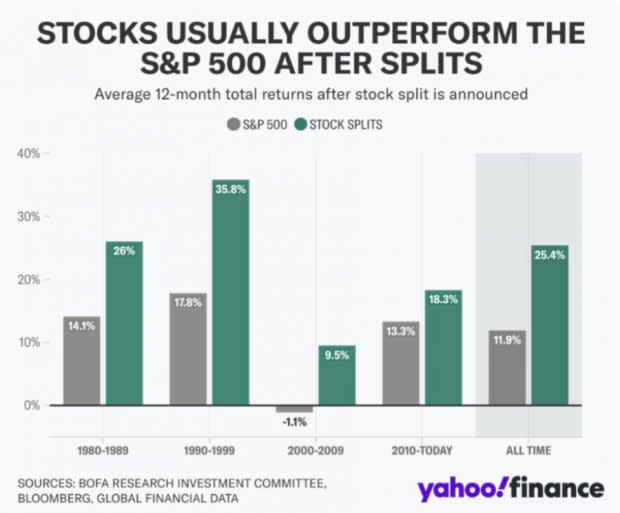
Image Source: BofA, Bloomberg
5. Lower Rates are Coming
The strong price performance of 2024 has been isolated to larger cap stocks, which are less sensitive to higher rates. However, Fed Chair Jerome Powell and the Federal Reserve are likely to cut interest rates before year-end, which should spark rate-sensitive market areas such as the Russell 2000 Index ETF (IWM) and the SPDR Regional Bank ETF (KRE).
Bottom Line
Five bullish catalysts suggest that stocks will be higher into year-end including election year seasonality, muted sentiment, 52-week highs, AI leadership, and lower interest rates on the horizon.
Want the latest recommendations from Zacks Investment Research? Today, you can download 7 Best Stocks for the Next 30 Days. Click to get this free report
NVIDIA Corporation (NVDA) : Free Stock Analysis Report
ARM Holdings PLC Sponsored ADR (ARM) : Free Stock Analysis Report
iShares Russell 2000 ETF (IWM): ETF Research Reports
Arista Networks, Inc. (ANET) : Free Stock Analysis Report
SPDR S&P Regional Banking ETF (KRE): ETF Research Reports
