
 Yahoo Finance
 The Esker (EPA:ALESK) Share Price Has Soared 451%, Delighting Many Shareholders

Buying shares in the best businesses can build meaningful wealth for you and your family. While the best companies are hard to find, but they can generate massive returns over long periods. To wit, the Esker SA (EPA:ALESK) share price has soared 451% over five years. If that doesn't get you thinking about long term investing, we don't know what will. Also pleasing for shareholders was the 15% gain in the last three months. But this could be related to the strong market, which is up 10.0% in the last three months.
See our latest analysis for Esker
To paraphrase Benjamin Graham: Over the short term the market is a voting machine, but over the long term it's a weighing machine. One way to examine how market sentiment has changed over time is to look at the interaction between a company's share price and its earnings per share (EPS).
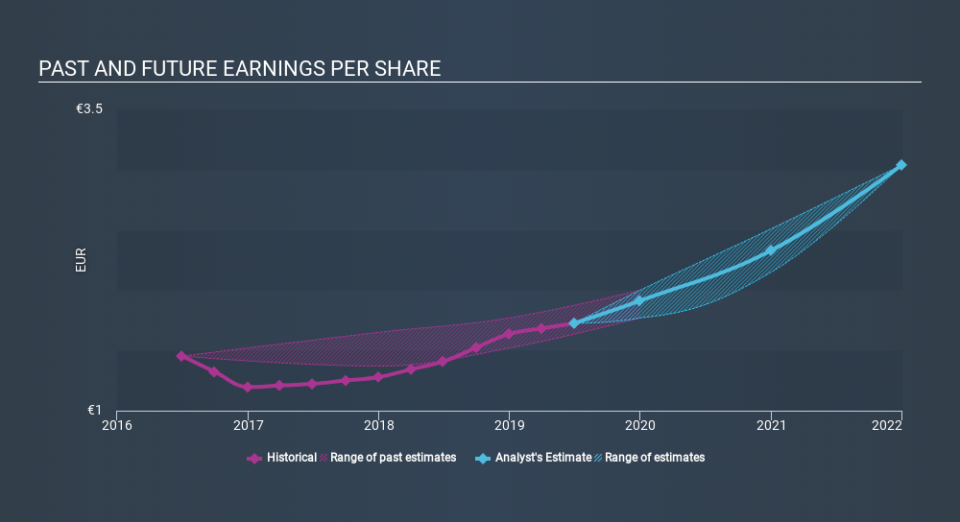
Over half a decade, Esker managed to grow its earnings per share at 18% a year. This EPS growth is lower than the 41% average annual increase in the share price. So it's fair to assume the market has a higher opinion of the business than it did five years ago. That's not necessarily surprising considering the five-year track record of earnings growth. This favorable sentiment is reflected in its (fairly optimistic) P/E ratio of 53.56.
You can see how EPS has changed over time in the image below (click on the chart to see the exact values).
We know that Esker has improved its bottom line lately, but is it going to grow revenue? This free report showing analyst revenue forecasts should help you figure out if the EPS growth can be sustained.
What About Dividends?
As well as measuring the share price return, investors should also consider the total shareholder return (TSR). The TSR is a return calculation that accounts for the value of cash dividends (assuming that any dividend received was reinvested) and the calculated value of any discounted capital raisings and spin-offs. Arguably, the TSR gives a more comprehensive picture of the return generated by a stock. We note that for Esker the TSR over the last 5 years was 470%, which is better than the share price return mentioned above. This is largely a result of its dividend payments!
A Different Perspective
We're pleased to report that Esker shareholders have received a total shareholder return of 59% over one year. And that does include the dividend. Since the one-year TSR is better than the five-year TSR (the latter coming in at 42% per year), it would seem that the stock's performance has improved in recent times. In the best case scenario, this may hint at some real business momentum, implying that now could be a great time to delve deeper. Is Esker cheap compared to other companies? These 3 valuation measures might help you decide.
If you like to buy stocks alongside management, then you might just love this free list of companies. (Hint: insiders have been buying them).
Please note, the market returns quoted in this article reflect the market weighted average returns of stocks that currently trade on FR exchanges.
If you spot an error that warrants correction, please contact the editor at editorial-team@simplywallst.com. This article by Simply Wall St is general in nature. It does not constitute a recommendation to buy or sell any stock, and does not take account of your objectives, or your financial situation. Simply Wall St has no position in the stocks mentioned.
We aim to bring you long-term focused research analysis driven by fundamental data. Note that our analysis may not factor in the latest price-sensitive company announcements or qualitative material. Thank you for reading.
