
 Yahoo Finance
 Should You Like Esker SA’s (EPA:ALESK) High Return On Capital Employed?

Today we are going to look at Esker SA (EPA:ALESK) to see whether it might be an attractive investment prospect. Specifically, we're going to calculate its Return On Capital Employed (ROCE), in the hopes of getting some insight into the business.
First of all, we'll work out how to calculate ROCE. Then we'll compare its ROCE to similar companies. Finally, we'll look at how its current liabilities affect its ROCE.
Understanding Return On Capital Employed (ROCE)
ROCE measures the amount of pre-tax profits a company can generate from the capital employed in its business. In general, businesses with a higher ROCE are usually better quality. Ultimately, it is a useful but imperfect metric. Author Edwin Whiting says to be careful when comparing the ROCE of different businesses, since 'No two businesses are exactly alike.
So, How Do We Calculate ROCE?
Analysts use this formula to calculate return on capital employed:
Return on Capital Employed = Earnings Before Interest and Tax (EBIT) ÷ (Total Assets - Current Liabilities)
Or for Esker:
0.21 = €12m ÷ (€99m - €41m) (Based on the trailing twelve months to December 2019.)
So, Esker has an ROCE of 21%.
See our latest analysis for Esker
Does Esker Have A Good ROCE?
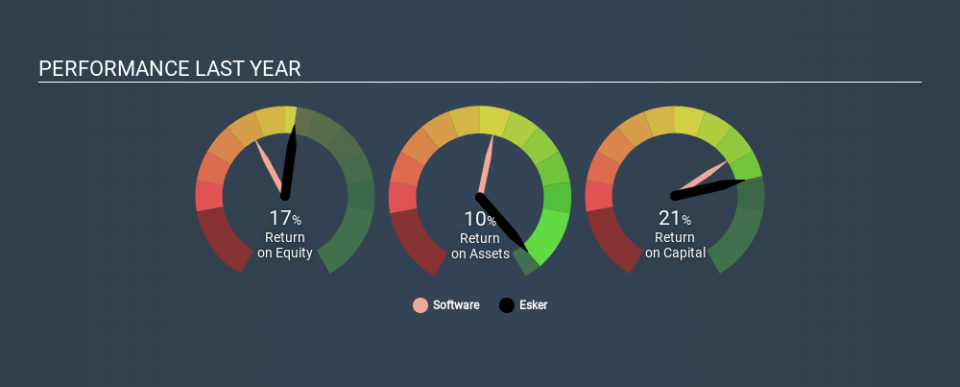
ROCE is commonly used for comparing the performance of similar businesses. In our analysis, Esker's ROCE is meaningfully higher than the 9.1% average in the Software industry. We would consider this a positive, as it suggests it is using capital more effectively than other similar companies. Setting aside the comparison to its industry for a moment, Esker's ROCE in absolute terms currently looks quite high.
You can see in the image below how Esker's ROCE compares to its industry. Click to see more on past growth.
When considering this metric, keep in mind that it is backwards looking, and not necessarily predictive. ROCE can be deceptive for cyclical businesses, as returns can look incredible in boom times, and terribly low in downturns. ROCE is only a point-in-time measure. What happens in the future is pretty important for investors, so we have prepared a free report on analyst forecasts for Esker.
How Esker's Current Liabilities Impact Its ROCE
Current liabilities include invoices, such as supplier payments, short-term debt, or a tax bill, that need to be paid within 12 months. The ROCE equation subtracts current liabilities from capital employed, so a company with a lot of current liabilities appears to have less capital employed, and a higher ROCE than otherwise. To counter this, investors can check if a company has high current liabilities relative to total assets.
Esker has current liabilities of €41m and total assets of €99m. Therefore its current liabilities are equivalent to approximately 41% of its total assets. A medium level of current liabilities boosts Esker's ROCE somewhat.
The Bottom Line On Esker's ROCE
Even so, it has a great ROCE, and could be an attractive prospect for further research. Esker shapes up well under this analysis, but it is far from the only business delivering excellent numbers . You might also want to check this free collection of companies delivering excellent earnings growth.
For those who like to find winning investments this free list of growing companies with recent insider purchasing, could be just the ticket.
If you spot an error that warrants correction, please contact the editor at editorial-team@simplywallst.com. This article by Simply Wall St is general in nature. It does not constitute a recommendation to buy or sell any stock, and does not take account of your objectives, or your financial situation. Simply Wall St has no position in the stocks mentioned.
We aim to bring you long-term focused research analysis driven by fundamental data. Note that our analysis may not factor in the latest price-sensitive company announcements or qualitative material. Thank you for reading.
