
 Yahoo Finance
 Estimating The Fair Value Of Dewhurst Group Plc (LON:DWHT)
Key Insights
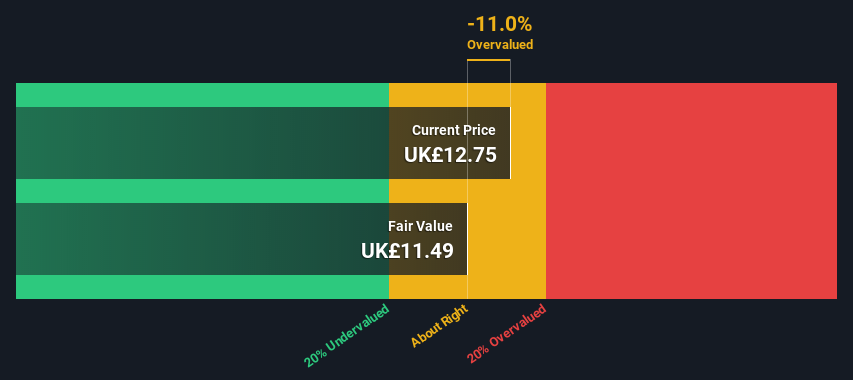
Dewhurst Group's estimated fair value is UK£11.49 based on 2 Stage Free Cash Flow to Equity
Dewhurst Group's UK£12.75 share price indicates it is trading at similar levels as its fair value estimate
When compared to theindustry average discount of -6,982%, Dewhurst Group's competitors seem to be trading at a greater premium to fair value
Does the February share price for Dewhurst Group Plc (LON:DWHT) reflect what it's really worth? Today, we will estimate the stock's intrinsic value by taking the expected future cash flows and discounting them to today's value. We will take advantage of the Discounted Cash Flow (DCF) model for this purpose. Believe it or not, it's not too difficult to follow, as you'll see from our example!
Companies can be valued in a lot of ways, so we would point out that a DCF is not perfect for every situation. If you want to learn more about discounted cash flow, the rationale behind this calculation can be read in detail in the Simply Wall St analysis model.
See our latest analysis for Dewhurst Group
Is Dewhurst Group Fairly Valued?
We use what is known as a 2-stage model, which simply means we have two different periods of growth rates for the company's cash flows. Generally the first stage is higher growth, and the second stage is a lower growth phase. To start off with, we need to estimate the next ten years of cash flows. Where possible we use analyst estimates, but when these aren't available we extrapolate the previous free cash flow (FCF) from the last estimate or reported value. We assume companies with shrinking free cash flow will slow their rate of shrinkage, and that companies with growing free cash flow will see their growth rate slow, over this period. We do this to reflect that growth tends to slow more in the early years than it does in later years.
A DCF is all about the idea that a dollar in the future is less valuable than a dollar today, and so the sum of these future cash flows is then discounted to today's value:
10-year free cash flow (FCF) forecast
2023 | 2024 | 2025 | 2026 | 2027 | 2028 | 2029 | 2030 | 2031 | 2032 | |
Levered FCF (£, Millions) | UK£4.78m | UK£5.84m | UK£6.61m | UK£7.24m | UK£7.75m | UK£8.16m | UK£8.49m | UK£8.76m | UK£8.98m | UK£9.17m |
Growth Rate Estimate Source | Analyst x1 | Analyst x1 | Est @ 13.15% | Est @ 9.55% | Est @ 7.03% | Est @ 5.27% | Est @ 4.03% | Est @ 3.17% | Est @ 2.56% | Est @ 2.14% |
Present Value (£, Millions) Discounted @ 9.3% | UK£4.4 | UK£4.9 | UK£5.1 | UK£5.1 | UK£5.0 | UK£4.8 | UK£4.6 | UK£4.3 | UK£4.0 | UK£3.8 |
("Est" = FCF growth rate estimated by Simply Wall St)
Present Value of 10-year Cash Flow (PVCF) = UK£46m
The second stage is also known as Terminal Value, this is the business's cash flow after the first stage. The Gordon Growth formula is used to calculate Terminal Value at a future annual growth rate equal to the 5-year average of the 10-year government bond yield of 1.2%. We discount the terminal cash flows to today's value at a cost of equity of 9.3%.
Terminal Value (TV)= FCF2032 × (1 + g) ÷ (r – g) = UK£9.2m× (1 + 1.2%) ÷ (9.3%– 1.2%) = UK£114m
Present Value of Terminal Value (PVTV)= TV / (1 + r)10= UK£114m÷ ( 1 + 9.3%)10= UK£47m
The total value, or equity value, is then the sum of the present value of the future cash flows, which in this case is UK£93m. The last step is to then divide the equity value by the number of shares outstanding. Relative to the current share price of UK£12.8, the company appears around fair value at the time of writing. The assumptions in any calculation have a big impact on the valuation, so it is better to view this as a rough estimate, not precise down to the last cent.
Important Assumptions
Now the most important inputs to a discounted cash flow are the discount rate, and of course, the actual cash flows. If you don't agree with these result, have a go at the calculation yourself and play with the assumptions. The DCF also does not consider the possible cyclicality of an industry, or a company's future capital requirements, so it does not give a full picture of a company's potential performance. Given that we are looking at Dewhurst Group as potential shareholders, the cost of equity is used as the discount rate, rather than the cost of capital (or weighted average cost of capital, WACC) which accounts for debt. In this calculation we've used 9.3%, which is based on a levered beta of 1.166. Beta is a measure of a stock's volatility, compared to the market as a whole. We get our beta from the industry average beta of globally comparable companies, with an imposed limit between 0.8 and 2.0, which is a reasonable range for a stable business.
Next Steps:
Although the valuation of a company is important, it ideally won't be the sole piece of analysis you scrutinize for a company. It's not possible to obtain a foolproof valuation with a DCF model. Preferably you'd apply different cases and assumptions and see how they would impact the company's valuation. If a company grows at a different rate, or if its cost of equity or risk free rate changes sharply, the output can look very different. For Dewhurst Group, there are three relevant factors you should assess:
Risks: For example, we've discovered 2 warning signs for Dewhurst Group that you should be aware of before investing here.
Management:Have insiders been ramping up their shares to take advantage of the market's sentiment for DWHT's future outlook? Check out our management and board analysis with insights on CEO compensation and governance factors.
Other High Quality Alternatives: Do you like a good all-rounder? Explore our interactive list of high quality stocks to get an idea of what else is out there you may be missing!
PS. The Simply Wall St app conducts a discounted cash flow valuation for every stock on the AIM every day. If you want to find the calculation for other stocks just search here.
Have feedback on this article? Concerned about the content? Get in touch with us directly. Alternatively, email editorial-team (at) simplywallst.com.
This article by Simply Wall St is general in nature. We provide commentary based on historical data and analyst forecasts only using an unbiased methodology and our articles are not intended to be financial advice. It does not constitute a recommendation to buy or sell any stock, and does not take account of your objectives, or your financial situation. We aim to bring you long-term focused analysis driven by fundamental data. Note that our analysis may not factor in the latest price-sensitive company announcements or qualitative material. Simply Wall St has no position in any stocks mentioned.
Join A Paid User Research Session
You’ll receive a US$30 Amazon Gift card for 1 hour of your time while helping us build better investing tools for the individual investors like yourself. Sign up here
