
 Yahoo Finance
 Estimating The Fair Value Of Shin Yang Group Berhad (KLSE:SYGROUP)
Key Insights
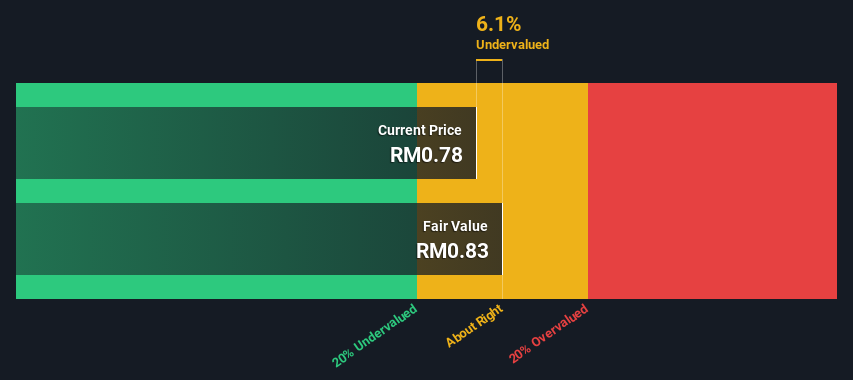
Using the 2 Stage Free Cash Flow to Equity, Shin Yang Group Berhad fair value estimate is RM0.83
Current share price of RM0.78 suggests Shin Yang Group Berhad is potentially trading close to its fair value
Shin Yang Group Berhad's peers seem to be trading at a higher discount to fair value based onthe industry average of 41%
How far off is Shin Yang Group Berhad (KLSE:SYGROUP) from its intrinsic value? Using the most recent financial data, we'll take a look at whether the stock is fairly priced by taking the expected future cash flows and discounting them to their present value. Our analysis will employ the Discounted Cash Flow (DCF) model. Before you think you won't be able to understand it, just read on! It's actually much less complex than you'd imagine.
We would caution that there are many ways of valuing a company and, like the DCF, each technique has advantages and disadvantages in certain scenarios. If you still have some burning questions about this type of valuation, take a look at the Simply Wall St analysis model.
See our latest analysis for Shin Yang Group Berhad
Step By Step Through The Calculation
We're using the 2-stage growth model, which simply means we take in account two stages of company's growth. In the initial period the company may have a higher growth rate and the second stage is usually assumed to have a stable growth rate. To begin with, we have to get estimates of the next ten years of cash flows. Seeing as no analyst estimates of free cash flow are available to us, we have extrapolate the previous free cash flow (FCF) from the company's last reported value. We assume companies with shrinking free cash flow will slow their rate of shrinkage, and that companies with growing free cash flow will see their growth rate slow, over this period. We do this to reflect that growth tends to slow more in the early years than it does in later years.
Generally we assume that a dollar today is more valuable than a dollar in the future, so we need to discount the sum of these future cash flows to arrive at a present value estimate:
10-year free cash flow (FCF) estimate
2024 | 2025 | 2026 | 2027 | 2028 | 2029 | 2030 | 2031 | 2032 | 2033 | |
Levered FCF (MYR, Millions) | RM80.6m | RM72.6m | RM68.3m | RM66.2m | RM65.4m | RM65.6m | RM66.5m | RM67.8m | RM69.4m | RM71.3m |
Growth Rate Estimate Source | Est @ -15.80% | Est @ -9.99% | Est @ -5.93% | Est @ -3.09% | Est @ -1.10% | Est @ 0.30% | Est @ 1.27% | Est @ 1.96% | Est @ 2.43% | Est @ 2.77% |
Present Value (MYR, Millions) Discounted @ 9.5% | RM73.6 | RM60.5 | RM52.0 | RM46.0 | RM41.5 | RM38.0 | RM35.2 | RM32.8 | RM30.6 | RM28.8 |
("Est" = FCF growth rate estimated by Simply Wall St)
Present Value of 10-year Cash Flow (PVCF) = RM439m
The second stage is also known as Terminal Value, this is the business's cash flow after the first stage. For a number of reasons a very conservative growth rate is used that cannot exceed that of a country's GDP growth. In this case we have used the 5-year average of the 10-year government bond yield (3.6%) to estimate future growth. In the same way as with the 10-year 'growth' period, we discount future cash flows to today's value, using a cost of equity of 9.5%.
Terminal Value (TV)= FCF2033 × (1 + g) ÷ (r – g) = RM71m× (1 + 3.6%) ÷ (9.5%– 3.6%) = RM1.2b
Present Value of Terminal Value (PVTV)= TV / (1 + r)10= RM1.2b÷ ( 1 + 9.5%)10= RM499m
The total value is the sum of cash flows for the next ten years plus the discounted terminal value, which results in the Total Equity Value, which in this case is RM938m. The last step is to then divide the equity value by the number of shares outstanding. Relative to the current share price of RM0.8, the company appears about fair value at a 6.1% discount to where the stock price trades currently. Remember though, that this is just an approximate valuation, and like any complex formula - garbage in, garbage out.
Important Assumptions
The calculation above is very dependent on two assumptions. The first is the discount rate and the other is the cash flows. If you don't agree with these result, have a go at the calculation yourself and play with the assumptions. The DCF also does not consider the possible cyclicality of an industry, or a company's future capital requirements, so it does not give a full picture of a company's potential performance. Given that we are looking at Shin Yang Group Berhad as potential shareholders, the cost of equity is used as the discount rate, rather than the cost of capital (or weighted average cost of capital, WACC) which accounts for debt. In this calculation we've used 9.5%, which is based on a levered beta of 0.939. Beta is a measure of a stock's volatility, compared to the market as a whole. We get our beta from the industry average beta of globally comparable companies, with an imposed limit between 0.8 and 2.0, which is a reasonable range for a stable business.
SWOT Analysis for Shin Yang Group Berhad
Strength
Debt is not viewed as a risk.
Dividends are covered by earnings and cash flows.
Weakness
Earnings declined over the past year.
Dividend is low compared to the top 25% of dividend payers in the Shipping market.
Opportunity
Current share price is below our estimate of fair value.
Lack of analyst coverage makes it difficult to determine SYGROUP's earnings prospects.
Threat
No apparent threats visible for SYGROUP.
Moving On:
Valuation is only one side of the coin in terms of building your investment thesis, and it is only one of many factors that you need to assess for a company. DCF models are not the be-all and end-all of investment valuation. Preferably you'd apply different cases and assumptions and see how they would impact the company's valuation. If a company grows at a different rate, or if its cost of equity or risk free rate changes sharply, the output can look very different. For Shin Yang Group Berhad, there are three fundamental aspects you should further research:
Risks: As an example, we've found 2 warning signs for Shin Yang Group Berhad that you need to consider before investing here.
Other Solid Businesses: Low debt, high returns on equity and good past performance are fundamental to a strong business. Why not explore our interactive list of stocks with solid business fundamentals to see if there are other companies you may not have considered!
Other Environmentally-Friendly Companies: Concerned about the environment and think consumers will buy eco-friendly products more and more? Browse through our interactive list of companies that are thinking about a greener future to discover some stocks you may not have thought of!
PS. The Simply Wall St app conducts a discounted cash flow valuation for every stock on the KLSE every day. If you want to find the calculation for other stocks just search here.
Have feedback on this article? Concerned about the content? Get in touch with us directly. Alternatively, email editorial-team (at) simplywallst.com.
This article by Simply Wall St is general in nature. We provide commentary based on historical data and analyst forecasts only using an unbiased methodology and our articles are not intended to be financial advice. It does not constitute a recommendation to buy or sell any stock, and does not take account of your objectives, or your financial situation. We aim to bring you long-term focused analysis driven by fundamental data. Note that our analysis may not factor in the latest price-sensitive company announcements or qualitative material. Simply Wall St has no position in any stocks mentioned.
Have feedback on this article? Concerned about the content? Get in touch with us directly. Alternatively, email editorial-team@simplywallst.com
