
 Yahoo Finance
 Estimating The Fair Value Of Springfield Properties Plc (LON:SPR)
Key Insights
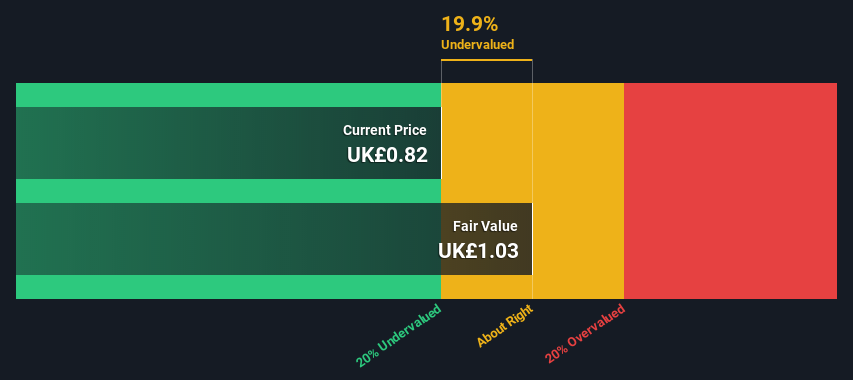
Using the 2 Stage Free Cash Flow to Equity, Springfield Properties fair value estimate is UK£1.03
Current share price of UK£0.82 suggests Springfield Properties is potentially trading close to its fair value
The UK£1.25 analyst price target for SPR is 21% more than our estimate of fair value
How far off is Springfield Properties Plc (LON:SPR) from its intrinsic value? Using the most recent financial data, we'll take a look at whether the stock is fairly priced by projecting its future cash flows and then discounting them to today's value. We will use the Discounted Cash Flow (DCF) model on this occasion. Don't get put off by the jargon, the math behind it is actually quite straightforward.
We would caution that there are many ways of valuing a company and, like the DCF, each technique has advantages and disadvantages in certain scenarios. If you still have some burning questions about this type of valuation, take a look at the Simply Wall St analysis model.
Check out our latest analysis for Springfield Properties
The Method
We use what is known as a 2-stage model, which simply means we have two different periods of growth rates for the company's cash flows. Generally the first stage is higher growth, and the second stage is a lower growth phase. To begin with, we have to get estimates of the next ten years of cash flows. Where possible we use analyst estimates, but when these aren't available we extrapolate the previous free cash flow (FCF) from the last estimate or reported value. We assume companies with shrinking free cash flow will slow their rate of shrinkage, and that companies with growing free cash flow will see their growth rate slow, over this period. We do this to reflect that growth tends to slow more in the early years than it does in later years.
Generally we assume that a dollar today is more valuable than a dollar in the future, so we need to discount the sum of these future cash flows to arrive at a present value estimate:
10-year free cash flow (FCF) forecast
2023 | 2024 | 2025 | 2026 | 2027 | 2028 | 2029 | 2030 | 2031 | 2032 | |
Levered FCF (£, Millions) | UK£15.9m | UK£30.2m | UK£21.2m | UK£16.5m | UK£14.0m | UK£12.5m | UK£11.7m | UK£11.1m | UK£10.8m | UK£10.7m |
Growth Rate Estimate Source | Analyst x1 | Analyst x2 | Analyst x1 | Est @ -22.26% | Est @ -15.24% | Est @ -10.32% | Est @ -6.88% | Est @ -4.47% | Est @ -2.78% | Est @ -1.60% |
Present Value (£, Millions) Discounted @ 13% | UK£14.1 | UK£23.8 | UK£14.9 | UK£10.3 | UK£7.7 | UK£6.1 | UK£5.1 | UK£4.3 | UK£3.7 | UK£3.3 |
("Est" = FCF growth rate estimated by Simply Wall St)
Present Value of 10-year Cash Flow (PVCF) = UK£93m
After calculating the present value of future cash flows in the initial 10-year period, we need to calculate the Terminal Value, which accounts for all future cash flows beyond the first stage. The Gordon Growth formula is used to calculate Terminal Value at a future annual growth rate equal to the 5-year average of the 10-year government bond yield of 1.2%. We discount the terminal cash flows to today's value at a cost of equity of 13%.
Terminal Value (TV)= FCF2032 × (1 + g) ÷ (r – g) = UK£11m× (1 + 1.2%) ÷ (13%– 1.2%) = UK£94m
Present Value of Terminal Value (PVTV)= TV / (1 + r)10= UK£94m÷ ( 1 + 13%)10= UK£29m
The total value is the sum of cash flows for the next ten years plus the discounted terminal value, which results in the Total Equity Value, which in this case is UK£122m. To get the intrinsic value per share, we divide this by the total number of shares outstanding. Relative to the current share price of UK£0.8, the company appears about fair value at a 20% discount to where the stock price trades currently. Valuations are imprecise instruments though, rather like a telescope - move a few degrees and end up in a different galaxy. Do keep this in mind.
The Assumptions
Now the most important inputs to a discounted cash flow are the discount rate, and of course, the actual cash flows. If you don't agree with these result, have a go at the calculation yourself and play with the assumptions. The DCF also does not consider the possible cyclicality of an industry, or a company's future capital requirements, so it does not give a full picture of a company's potential performance. Given that we are looking at Springfield Properties as potential shareholders, the cost of equity is used as the discount rate, rather than the cost of capital (or weighted average cost of capital, WACC) which accounts for debt. In this calculation we've used 13%, which is based on a levered beta of 1.641. Beta is a measure of a stock's volatility, compared to the market as a whole. We get our beta from the industry average beta of globally comparable companies, with an imposed limit between 0.8 and 2.0, which is a reasonable range for a stable business.
SWOT Analysis for Springfield Properties
Strength
Earnings growth over the past year exceeded the industry.
Debt is well covered by earnings and cashflows.
Dividends are covered by earnings and cash flows.
Dividend is in the top 25% of dividend payers in the market.
Weakness
No major weaknesses identified for SPR.
Opportunity
Annual earnings are forecast to grow for the next 3 years.
Good value based on P/E ratio and estimated fair value.
Significant insider buying over the past 3 months.
Threat
Annual earnings are forecast to grow slower than the British market.
Looking Ahead:
Whilst important, the DCF calculation shouldn't be the only metric you look at when researching a company. It's not possible to obtain a foolproof valuation with a DCF model. Rather it should be seen as a guide to "what assumptions need to be true for this stock to be under/overvalued?" For example, changes in the company's cost of equity or the risk free rate can significantly impact the valuation. For Springfield Properties, we've put together three additional factors you should further research:
Risks: For example, we've discovered 2 warning signs for Springfield Properties that you should be aware of before investing here.
Management:Have insiders been ramping up their shares to take advantage of the market's sentiment for SPR's future outlook? Check out our management and board analysis with insights on CEO compensation and governance factors.
Other High Quality Alternatives: Do you like a good all-rounder? Explore our interactive list of high quality stocks to get an idea of what else is out there you may be missing!
PS. Simply Wall St updates its DCF calculation for every British stock every day, so if you want to find the intrinsic value of any other stock just search here.
Have feedback on this article? Concerned about the content? Get in touch with us directly. Alternatively, email editorial-team (at) simplywallst.com.
This article by Simply Wall St is general in nature. We provide commentary based on historical data and analyst forecasts only using an unbiased methodology and our articles are not intended to be financial advice. It does not constitute a recommendation to buy or sell any stock, and does not take account of your objectives, or your financial situation. We aim to bring you long-term focused analysis driven by fundamental data. Note that our analysis may not factor in the latest price-sensitive company announcements or qualitative material. Simply Wall St has no position in any stocks mentioned.
Join A Paid User Research Session
You’ll receive a US$30 Amazon Gift card for 1 hour of your time while helping us build better investing tools for the individual investors like yourself. Sign up here
