
 Yahoo Finance
 Estimating The Fair Value Of Volution Group plc (LON:FAN)

Today we'll do a simple run through of a valuation method used to estimate the attractiveness of Volution Group plc (LON:FAN) as an investment opportunity by taking the expected future cash flows and discounting them to their present value. Our analysis will employ the Discounted Cash Flow (DCF) model. Before you think you won't be able to understand it, just read on! It's actually much less complex than you'd imagine.
We would caution that there are many ways of valuing a company and, like the DCF, each technique has advantages and disadvantages in certain scenarios. For those who are keen learners of equity analysis, the Simply Wall St analysis model here may be something of interest to you.
Check out our latest analysis for Volution Group
Crunching the numbers
We are going to use a two-stage DCF model, which, as the name states, takes into account two stages of growth. The first stage is generally a higher growth period which levels off heading towards the terminal value, captured in the second 'steady growth' period. To start off with, we need to estimate the next ten years of cash flows. Where possible we use analyst estimates, but when these aren't available we extrapolate the previous free cash flow (FCF) from the last estimate or reported value. We assume companies with shrinking free cash flow will slow their rate of shrinkage, and that companies with growing free cash flow will see their growth rate slow, over this period. We do this to reflect that growth tends to slow more in the early years than it does in later years.
A DCF is all about the idea that a dollar in the future is less valuable than a dollar today, and so the sum of these future cash flows is then discounted to today's value:
10-year free cash flow (FCF) estimate
2021 | 2022 | 2023 | 2024 | 2025 | 2026 | 2027 | 2028 | 2029 | 2030 | |
Levered FCF (£, Millions) | UK£31.3m | UK£33.9m | UK£36.2m | UK£36.6m | UK£37.1m | UK£37.5m | UK£38.0m | UK£38.4m | UK£38.9m | UK£39.4m |
Growth Rate Estimate Source | Analyst x2 | Analyst x2 | Analyst x2 | Est @ 1.16% | Est @ 1.18% | Est @ 1.19% | Est @ 1.2% | Est @ 1.21% | Est @ 1.21% | Est @ 1.21% |
Present Value (£, Millions) Discounted @ 9.9% | UK£28.5 | UK£28.1 | UK£27.3 | UK£25.1 | UK£23.1 | UK£21.3 | UK£19.6 | UK£18.1 | UK£16.6 | UK£15.3 |
("Est" = FCF growth rate estimated by Simply Wall St)
Present Value of 10-year Cash Flow (PVCF) = UK£223m
We now need to calculate the Terminal Value, which accounts for all the future cash flows after this ten year period. For a number of reasons a very conservative growth rate is used that cannot exceed that of a country's GDP growth. In this case we have used the 5-year average of the 10-year government bond yield (1.2%) to estimate future growth. In the same way as with the 10-year 'growth' period, we discount future cash flows to today's value, using a cost of equity of 9.9%.
Terminal Value (TV)= FCF2030 × (1 + g) ÷ (r – g) = UK£39m× (1 + 1.2%) ÷ (9.9%– 1.2%) = UK£459m
Present Value of Terminal Value (PVTV)= TV / (1 + r)10= UK£459m÷ ( 1 + 9.9%)10= UK£179m
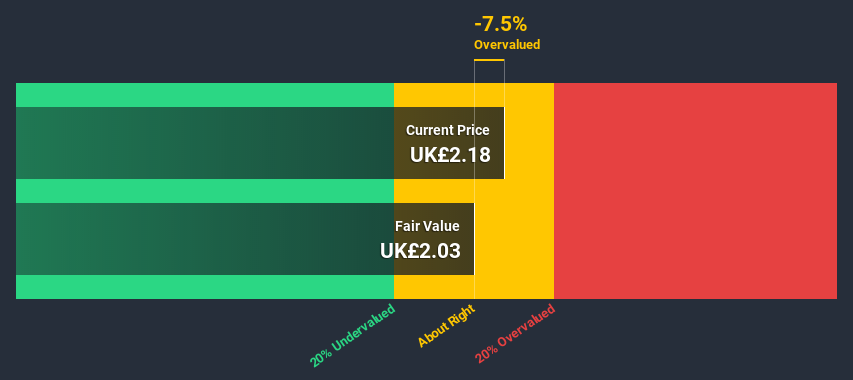
The total value, or equity value, is then the sum of the present value of the future cash flows, which in this case is UK£402m. To get the intrinsic value per share, we divide this by the total number of shares outstanding. Relative to the current share price of UK£2.2, the company appears around fair value at the time of writing. The assumptions in any calculation have a big impact on the valuation, so it is better to view this as a rough estimate, not precise down to the last cent.
The assumptions
The calculation above is very dependent on two assumptions. The first is the discount rate and the other is the cash flows. Part of investing is coming up with your own evaluation of a company's future performance, so try the calculation yourself and check your own assumptions. The DCF also does not consider the possible cyclicality of an industry, or a company's future capital requirements, so it does not give a full picture of a company's potential performance. Given that we are looking at Volution Group as potential shareholders, the cost of equity is used as the discount rate, rather than the cost of capital (or weighted average cost of capital, WACC) which accounts for debt. In this calculation we've used 9.9%, which is based on a levered beta of 1.254. Beta is a measure of a stock's volatility, compared to the market as a whole. We get our beta from the industry average beta of globally comparable companies, with an imposed limit between 0.8 and 2.0, which is a reasonable range for a stable business.
Moving On:
Valuation is only one side of the coin in terms of building your investment thesis, and it shouldn't be the only metric you look at when researching a company. It's not possible to obtain a foolproof valuation with a DCF model. Preferably you'd apply different cases and assumptions and see how they would impact the company's valuation. For instance, if the terminal value growth rate is adjusted slightly, it can dramatically alter the overall result. For Volution Group, we've compiled three additional factors you should further examine:
Risks: Be aware that Volution Group is showing 3 warning signs in our investment analysis , you should know about...
Future Earnings: How does FAN's growth rate compare to its peers and the wider market? Dig deeper into the analyst consensus number for the upcoming years by interacting with our free analyst growth expectation chart.
Other High Quality Alternatives: Do you like a good all-rounder? Explore our interactive list of high quality stocks to get an idea of what else is out there you may be missing!
PS. The Simply Wall St app conducts a discounted cash flow valuation for every stock on the LSE every day. If you want to find the calculation for other stocks just search here.
This article by Simply Wall St is general in nature. It does not constitute a recommendation to buy or sell any stock, and does not take account of your objectives, or your financial situation. We aim to bring you long-term focused analysis driven by fundamental data. Note that our analysis may not factor in the latest price-sensitive company announcements or qualitative material. Simply Wall St has no position in any stocks mentioned.
Have feedback on this article? Concerned about the content? Get in touch with us directly. Alternatively, email editorial-team@simplywallst.com.
