
 Yahoo Finance
 Estimating The Intrinsic Value Of Aevis Victoria SA (VTX:AEVS)
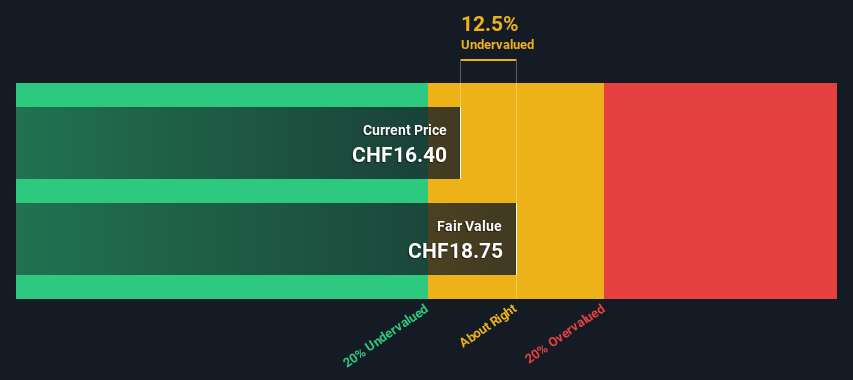
Key Insights
Aevis Victoria's estimated fair value is CHF18.75 based on Dividend Discount Model
With CHF16.40 share price, Aevis Victoria appears to be trading close to its estimated fair value
Aevis Victoria's peers seem to be trading at a higher discount to fair value based onthe industry average of 31%
Today we will run through one way of estimating the intrinsic value of Aevis Victoria SA (VTX:AEVS) by taking the forecast future cash flows of the company and discounting them back to today's value. We will take advantage of the Discounted Cash Flow (DCF) model for this purpose. Don't get put off by the jargon, the math behind it is actually quite straightforward.
Companies can be valued in a lot of ways, so we would point out that a DCF is not perfect for every situation. For those who are keen learners of equity analysis, the Simply Wall St analysis model here may be something of interest to you.
See our latest analysis for Aevis Victoria
What's The Estimated Valuation?
We have to calculate the value of Aevis Victoria slightly differently to other stocks because it is a healthcare company. Instead of using free cash flows, which are hard to estimate and often not reported by analysts in this industry, dividends per share (DPS) payments are used. Unless a company pays out the majority of its FCF as a dividend, this method will typically underestimate the value of the stock. We use the Gordon Growth Model, which assumes dividend will grow into perpetuity at a rate that can be sustained. For a number of reasons a very conservative growth rate is used that cannot exceed that of a company's Gross Domestic Product (GDP). In this case we used the 5-year average of the 10-year government bond yield (0.08%). The expected dividend per share is then discounted to today's value at a cost of equity of 4.1%. Compared to the current share price of CHF16.4, the company appears about fair value at a 13% discount to where the stock price trades currently. Remember though, that this is just an approximate valuation, and like any complex formula - garbage in, garbage out.
Value Per Share = Expected Dividend Per Share / (Discount Rate - Perpetual Growth Rate)
= CHF0.8 / (4.1% – 0.08%)
= CHF18.7
The Assumptions
Now the most important inputs to a discounted cash flow are the discount rate, and of course, the actual cash flows. You don't have to agree with these inputs, I recommend redoing the calculations yourself and playing with them. The DCF also does not consider the possible cyclicality of an industry, or a company's future capital requirements, so it does not give a full picture of a company's potential performance. Given that we are looking at Aevis Victoria as potential shareholders, the cost of equity is used as the discount rate, rather than the cost of capital (or weighted average cost of capital, WACC) which accounts for debt. In this calculation we've used 4.1%, which is based on a levered beta of 0.800. Beta is a measure of a stock's volatility, compared to the market as a whole. We get our beta from the industry average beta of globally comparable companies, with an imposed limit between 0.8 and 2.0, which is a reasonable range for a stable business.
SWOT Analysis for Aevis Victoria
Strength
Dividend is in the top 25% of dividend payers in the market.
Weakness
Earnings declined over the past year.
Interest payments on debt are not well covered.
Opportunity
Current share price is below our estimate of fair value.
Lack of analyst coverage makes it difficult to determine AEVS' earnings prospects.
Threat
Debt is not well covered by operating cash flow.
Dividends are not covered by earnings.
Looking Ahead:
Whilst important, the DCF calculation ideally won't be the sole piece of analysis you scrutinize for a company. It's not possible to obtain a foolproof valuation with a DCF model. Preferably you'd apply different cases and assumptions and see how they would impact the company's valuation. For instance, if the terminal value growth rate is adjusted slightly, it can dramatically alter the overall result. For Aevis Victoria, we've put together three important elements you should further examine:
Risks: To that end, you should learn about the 4 warning signs we've spotted with Aevis Victoria (including 2 which are a bit unpleasant) .
Other High Quality Alternatives: Do you like a good all-rounder? Explore our interactive list of high quality stocks to get an idea of what else is out there you may be missing!
Other Top Analyst Picks: Interested to see what the analysts are thinking? Take a look at our interactive list of analysts' top stock picks to find out what they feel might have an attractive future outlook!
PS. Simply Wall St updates its DCF calculation for every Swiss stock every day, so if you want to find the intrinsic value of any other stock just search here.
Have feedback on this article? Concerned about the content? Get in touch with us directly. Alternatively, email editorial-team (at) simplywallst.com.
This article by Simply Wall St is general in nature. We provide commentary based on historical data and analyst forecasts only using an unbiased methodology and our articles are not intended to be financial advice. It does not constitute a recommendation to buy or sell any stock, and does not take account of your objectives, or your financial situation. We aim to bring you long-term focused analysis driven by fundamental data. Note that our analysis may not factor in the latest price-sensitive company announcements or qualitative material. Simply Wall St has no position in any stocks mentioned.
