
 Yahoo Finance
 Estimating The Intrinsic Value Of Queen's Road Capital Investment Ltd. (TSE:QRC)
Key Insights
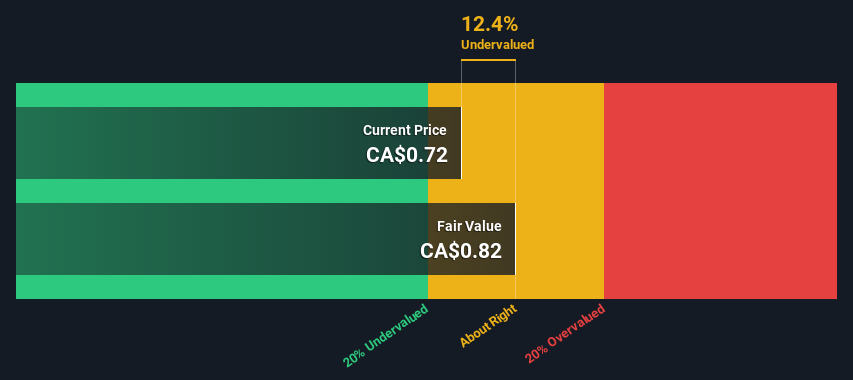
Using the 2 Stage Free Cash Flow to Equity, Queen's Road Capital Investment fair value estimate is CA$0.82
Queen's Road Capital Investment's CA$0.72 share price indicates it is trading at similar levels as its fair value estimate
Does the December share price for Queen's Road Capital Investment Ltd. (TSE:QRC) reflect what it's really worth? Today, we will estimate the stock's intrinsic value by taking the forecast future cash flows of the company and discounting them back to today's value. One way to achieve this is by employing the Discounted Cash Flow (DCF) model. There's really not all that much to it, even though it might appear quite complex.
We generally believe that a company's value is the present value of all of the cash it will generate in the future. However, a DCF is just one valuation metric among many, and it is not without flaws. If you still have some burning questions about this type of valuation, take a look at the Simply Wall St analysis model.
Check out our latest analysis for Queen's Road Capital Investment
The Calculation
We use what is known as a 2-stage model, which simply means we have two different periods of growth rates for the company's cash flows. Generally the first stage is higher growth, and the second stage is a lower growth phase. To begin with, we have to get estimates of the next ten years of cash flows. Seeing as no analyst estimates of free cash flow are available to us, we have extrapolate the previous free cash flow (FCF) from the company's last reported value. We assume companies with shrinking free cash flow will slow their rate of shrinkage, and that companies with growing free cash flow will see their growth rate slow, over this period. We do this to reflect that growth tends to slow more in the early years than it does in later years.
A DCF is all about the idea that a dollar in the future is less valuable than a dollar today, and so the sum of these future cash flows is then discounted to today's value:
10-year free cash flow (FCF) estimate
2024 | 2025 | 2026 | 2027 | 2028 | 2029 | 2030 | 2031 | 2032 | 2033 | |
Levered FCF ($, Millions) | US$5.95m | US$8.69m | US$11.5m | US$14.3m | US$16.7m | US$18.8m | US$20.5m | US$22.0m | US$23.2m | US$24.2m |
Growth Rate Estimate Source | Est @ 64.86% | Est @ 45.98% | Est @ 32.77% | Est @ 23.52% | Est @ 17.04% | Est @ 12.51% | Est @ 9.33% | Est @ 7.11% | Est @ 5.56% | Est @ 4.47% |
Present Value ($, Millions) Discounted @ 8.2% | US$5.5 | US$7.4 | US$9.1 | US$10.4 | US$11.2 | US$11.7 | US$11.8 | US$11.7 | US$11.4 | US$11.0 |
("Est" = FCF growth rate estimated by Simply Wall St)
Present Value of 10-year Cash Flow (PVCF) = US$101m
After calculating the present value of future cash flows in the initial 10-year period, we need to calculate the Terminal Value, which accounts for all future cash flows beyond the first stage. For a number of reasons a very conservative growth rate is used that cannot exceed that of a country's GDP growth. In this case we have used the 5-year average of the 10-year government bond yield (1.9%) to estimate future growth. In the same way as with the 10-year 'growth' period, we discount future cash flows to today's value, using a cost of equity of 8.2%.
Terminal Value (TV)= FCF2033 × (1 + g) ÷ (r – g) = US$24m× (1 + 1.9%) ÷ (8.2%– 1.9%) = US$394m
Present Value of Terminal Value (PVTV)= TV / (1 + r)10= US$394m÷ ( 1 + 8.2%)10= US$179m
The total value is the sum of cash flows for the next ten years plus the discounted terminal value, which results in the Total Equity Value, which in this case is US$281m. In the final step we divide the equity value by the number of shares outstanding. Relative to the current share price of CA$0.7, the company appears about fair value at a 12% discount to where the stock price trades currently. The assumptions in any calculation have a big impact on the valuation, so it is better to view this as a rough estimate, not precise down to the last cent.
The Assumptions
The calculation above is very dependent on two assumptions. The first is the discount rate and the other is the cash flows. If you don't agree with these result, have a go at the calculation yourself and play with the assumptions. The DCF also does not consider the possible cyclicality of an industry, or a company's future capital requirements, so it does not give a full picture of a company's potential performance. Given that we are looking at Queen's Road Capital Investment as potential shareholders, the cost of equity is used as the discount rate, rather than the cost of capital (or weighted average cost of capital, WACC) which accounts for debt. In this calculation we've used 8.2%, which is based on a levered beta of 1.061. Beta is a measure of a stock's volatility, compared to the market as a whole. We get our beta from the industry average beta of globally comparable companies, with an imposed limit between 0.8 and 2.0, which is a reasonable range for a stable business.
SWOT Analysis for Queen's Road Capital Investment
Strength
Currently debt free.
Weakness
Dividend is low compared to the top 25% of dividend payers in the Metals and Mining market.
Opportunity
Current share price is below our estimate of fair value.
Lack of analyst coverage makes it difficult to determine QRC's earnings prospects.
Threat
Dividends are not covered by earnings and cashflows.
Next Steps:
Although the valuation of a company is important, it is only one of many factors that you need to assess for a company. The DCF model is not a perfect stock valuation tool. Rather it should be seen as a guide to "what assumptions need to be true for this stock to be under/overvalued?" If a company grows at a different rate, or if its cost of equity or risk free rate changes sharply, the output can look very different. For Queen's Road Capital Investment, there are three additional factors you should assess:
Risks: Case in point, we've spotted 1 warning sign for Queen's Road Capital Investment you should be aware of.
Other High Quality Alternatives: Do you like a good all-rounder? Explore our interactive list of high quality stocks to get an idea of what else is out there you may be missing!
Other Top Analyst Picks: Interested to see what the analysts are thinking? Take a look at our interactive list of analysts' top stock picks to find out what they feel might have an attractive future outlook!
PS. The Simply Wall St app conducts a discounted cash flow valuation for every stock on the TSX every day. If you want to find the calculation for other stocks just search here.
Have feedback on this article? Concerned about the content? Get in touch with us directly. Alternatively, email editorial-team (at) simplywallst.com.
This article by Simply Wall St is general in nature. We provide commentary based on historical data and analyst forecasts only using an unbiased methodology and our articles are not intended to be financial advice. It does not constitute a recommendation to buy or sell any stock, and does not take account of your objectives, or your financial situation. We aim to bring you long-term focused analysis driven by fundamental data. Note that our analysis may not factor in the latest price-sensitive company announcements or qualitative material. Simply Wall St has no position in any stocks mentioned.
