
 Yahoo Finance
 Ethereum Price Forecast February 28, 2018, Technical Analysis
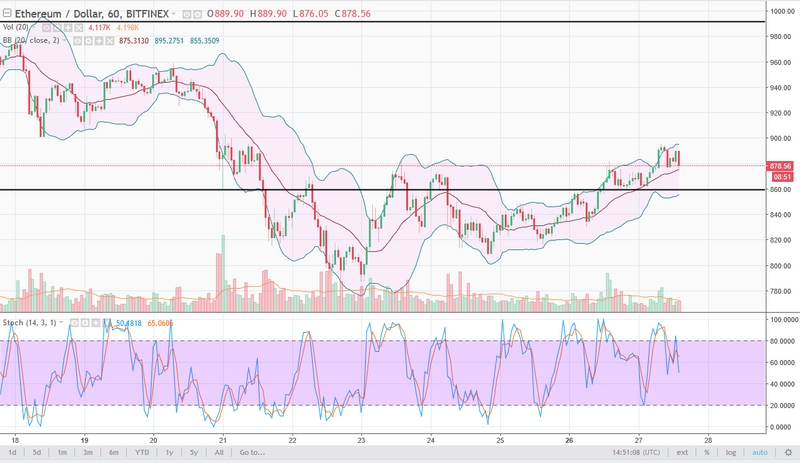
ETH/USD
Ethereum markets rallied a bit during the trading session on Monday, reaching towards the $900 level. If we can break above the $900 level, the market should then go to the $1000 level next. That would be a nice buying opportunity offering a 10% return. The market underneath should find plenty of support, based upon the basing pattern that we have started to form. I believe that the market continues to find plenty of reasons to rally at this point, and eventually I think that we could go above $1000, but it’s going to take a significant amount of pressure and momentum building. If we do break down from here, $800 should offer support.
Get Into Ethereum Trading Today
ETH/USD Video 28.02.18
ETH/EUR
Ethereum markets rallied against the Euro as well, reaching towards the €725 level. I believe that the market should then go to the €800 level above, which is the next major resistance barrier. Ultimately, I believe that the market will find buyers on dips, and I think we are trying to build up the necessary momentum to make that move. If we can break above the €800 level, I think that eventually we go looking towards €900 after that. Currently, I believe that the €640 level underneath is massive support, so a breakdown below there would probably send this market looking for the €600 level. However, when I look at the chart, it looks very much like a basing pattern just waiting to break out, so I have become bullish for the next several sessions.

This article was originally posted on FX Empire
