
 Yahoo Finance
 EUR/USD Forex Technical Analysis – Closed on Weak Side of Short-Term Retracement Zone, 1.1027 Next Downside Target
The Euro finished at its lowest level against the U.S. Dollar since August 1 on Friday as sellers responded to a report calling for aggressive action by the European Central Bank (ECB) to combat the weakening Euro Zone economy. The single currency was also feeling pressure from U.S. reports indicating trending growth.
On Friday, the EUR/USD settled at 1.1090, down 0.0019 or -0.17%.
The Euro’s plunge on Friday was driven by growing expectations of an interest rate cut by the ECB after Governing Council member Olli Rehn suggested on Thursday that the central bank could restart its quantitative easing program and was open to extending it into equity purchases.
In the U.S., the dollar was supported by a jump in permits to a seven-month high that offered hope for the struggling housing market. It also offset a steep decline in the construction of multi-family housing units. Better-than-expected retail sales data in the U.S. on Thursday also continued to underpin the greenback.
Daily Swing Chart Technical Analysis
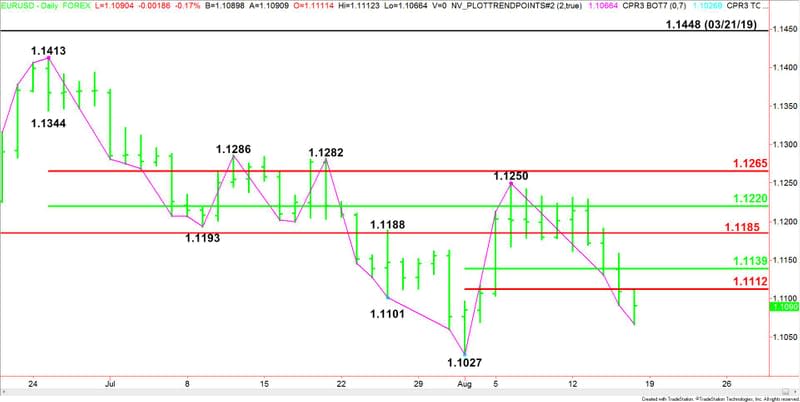
The main trend is down according to the daily swing chart. A trade through 1.1027 will reaffirm the downtrend. The main trend will change to up on a move through 1.1250.
The short-term range is 1.1027 to 1.1250. Its retracement zone at 1.1112 to 1.1139 is controlling the near-term direction of the Forex pair. Closing below this zone reaffirms the downside bias and confirms the zone as resistance.
The next resistance is a long-term Fibonacci level at 1.1185.
The main range is 1.1413 to 1.1027. Its retracement zone at 1.1220 to 1.1265 offers additional resistance.
Daily Swing Chart Technical Forecast
Based on Friday’s price action and the close at 1.1090, the direction of the EUR/USD on Monday is likely to be determined by trader reaction to the short-term Fibonacci level at 1.1112.
Bearish Scenario
A sustained move under 1.1112 will indicate the presence of sellers. Taking out last week’s low at 1.1066 will indicate the selling is getting stronger. This could trigger a further break into the August 1 main bottom at 1.1027.
Bullish Scenario
Overcoming and sustaining a move over 1.1112 will signal the return of buyers. This could trigger a rally into the short-term 50% level at 1.1139. This level is a potential trigger point for an acceleration into the long-term Fibonacci level at 1.1185.
This article was originally posted on FX Empire
More From FXEMPIRE:
NZD/USD Forex Technical Analysis – Closed on Weak Side of Minor Pivot at .6483
Bitcoin Cash – ABC, Litecoin and Ripple Daily Analysis – 17/08/19
US Stock Market Overview – Stocks Rally, but Finish the Week in the Red
Silver Weekly Price Forecast – Silver markets show exhaustion
Crude Oil Price Update – Rangebound – Strengthens Over $55.72, Weakens Under $53.95
