
 Yahoo Finance
 EUR/USD Mid-Session Technical Analysis for November 18, 2019
The Euro is trading higher against the U.S. Dollar as optimism grew about U.S.-China trade ties following a report of “constructive talks” over the weekend.
Chinese state media Xinhua reported Washington and Beijing had a high-level phone call on Saturday and that the two sides discussed each other’s core issues for the first phase of an initial trade agreement.
At 11:06 GMT, the EUR/USD is trading 1.1059, up 0.0007 or +0.06%.
Daily Technical Analysis
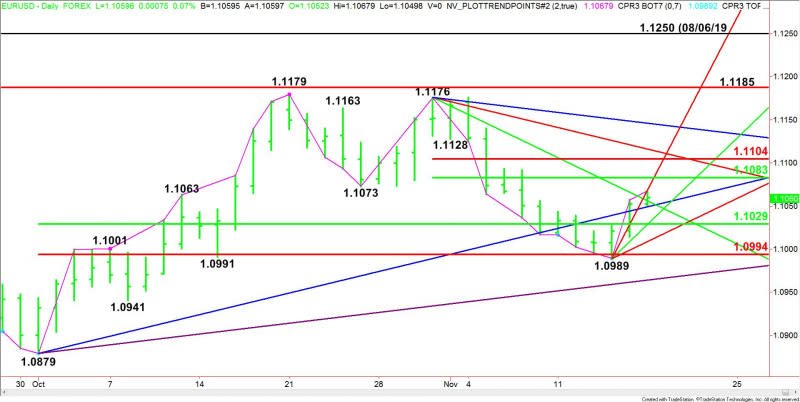
The main trend is down according to the daily swing chart. However, momentum has been trending higher since the formation of the closing price reversal on November 14 at 1.0989 and its subsequent confirmation.
A trade through 1.0989 will negate the closing price reversal bottom and signal a resumption of the downtrend. The main trend will change to up on a trade through 1.1176.
The main range is 1.0879 to 1.1179. Its retracement zone at 1.1029 to 1.0994 is support. This zone essentially stopped the selling last week at 1.0989.
The short-term range is 1.1176 to 1.0989. Its retracement zone at 1.1083 to 1.1104 is the first objective. Since the main trend is down, sellers are likely to come in on the initial test of this area.
Daily Technical Forecast
Based on the early price action and the current price at 1.1059, the direction of the EUR/USD the rest of the session on Monday is likely to be determined by trader reaction to the uptrending Gann angle at 1.1069 and the uptrending Gann angle at 1.1049.
Bullish Scenario
A sustained move over 1.1069 will indicate the presence of buyers. If this creates enough upside momentum then look for a rally into the short-term 50% level at 1.1083. Look for sellers on this test.
Overtaking 1.1083 could create the upside momentum needed to challenge the short-term Fibonacci level at 1.1104. Sellers could also come in on a test of this level.
Bearish Scenario
A sustained move under 1.1049 will signal the presence of sellers. This could trigger a break into a support cluster at 1.1029. Aggressive counter-trend buyers could come in on a test of this level. They are going to try to form a secondary higher bottom.
If 1.1029 fails as support then look for the selling to extend into the next uptrending Gann angle at 1.1009.
This article was originally posted on FX Empire
