
 Yahoo Finance
 EUR/USD Mid-Session Technical Analysis for October 1, 2020
The Euro is trading higher against the U.S. Dollar on Thursday as robust U.S. data and hopes for U.S. fiscal stimulus left investors confident enough to seek out riskier currencies.
Helping boost the Euro the previous session were jobs figures that showed U.S. private employers stepped up hiring more than forecast last month and that Midwest manufacturing grew faster than expected.
Meanwhile, Republican President Donald Trump’s administration has proposed a coronavirus stimulus package to House Democrats worth more than $1.5 trillion, and hopes are rising that both parties will reach a compromise.
At 11:48 GMT, the EUR/USD is trading 1.1761, up 0.0039 or +0.33%.
In other news, the recovery in Euro Zone manufacturing activity gathered pace last month but it was largely driven by strength in powerhouse Germany, and rising coronavirus cases across the region may yet reverse the upturn, a survey.
Surging demand after the initial relaxation pushed IHS Markit’s final Manufacturing Purchasing Managers’ Index to 53.7 in September from August’s 51.7, in line with an earlier flash reading and its highest level since August 2018.
Daily Swing Chart Technical Analysis
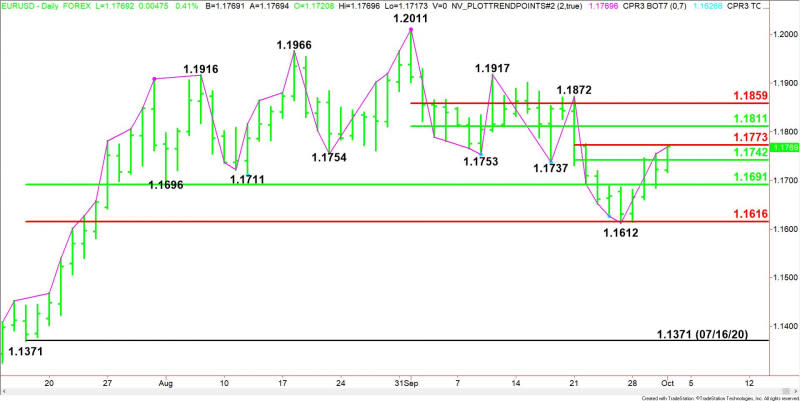
The main trend is up according to the daily swing chart. A trade through 1.1612 will signal a resumption of the downtrend. The main trend will change to up on a trade through 1.1872.
The main range is 1.1371 to 1.2011. Its retracement zone at 1.1691 to 1.1616 is support.
The first short-term range is 1.1872 to 1.1612. Its retracement zone at 1.1742 to 1.1773 is currently being tested.
The second short-term range is 1.2011 to 1.1612. Its retracement zone at 1.1811 to 1.1859 is the primary upside target area.
Daily Swing Chart Technical Forecast
Based on the early price action, the next short-term move is likely to be determined by trader reaction to the 50% level at 1.1742 and the Fibonacci level at 1.1773.
Bullish Scenario
A sustained move over 1.1773 will indicate the presence of buyers. This could trigger a surge into the next 50% level at 1.1811.
Bearish Scenario
A sustained move under 1.1773 will signal the presence of sellers. If this creates enough downside momentum then look for a pullback into the main 50% level at 1.1691.
For a look at all of today’s economic events, check out our economic calendar.
This article was originally posted on FX Empire
More From FXEMPIRE:
AUD/USD Price Forecast – Australian Dollar Running Into Exhaustion
Silver Price Daily Forecast – Support At $23.30 Stays Strong
PepsiCo Q3 Revenue Grows Over 5% to $18.09 Billion, Forecasts Solid 2020 Earnings; Target Price $155
USD/JPY Price Forecast – US Dollar Continues to Grind Against Yen
U.S. Stocks Set To Open Higher On Hopes For A New Stimulus Package
