
 Yahoo Finance
 EUR/USD Mid-Session Technical Analysis for November 16, 2017
The EUR/USD is trading lower on Thursday. Lower demand for risky assets and the divergence between the hawkish U.S. Federal Reserve and the dovish European Central Bank is weighing on the Forex pair.
Daily Technical Analysis
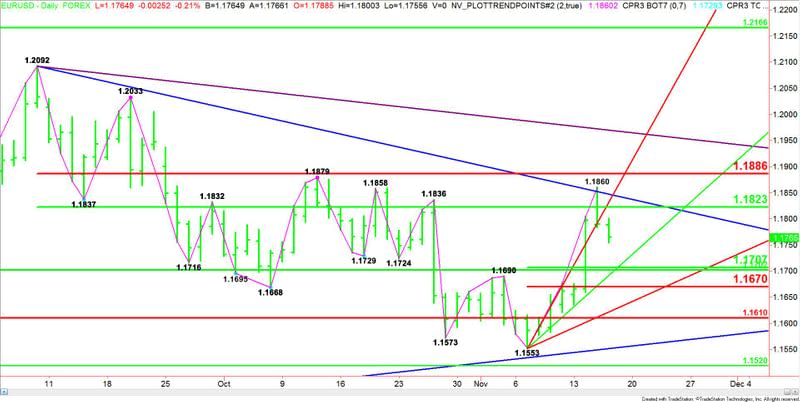
The main trend is up according to the daily swing chart. Today’s price action has made 1.1860 a new minor top. A trade through 1.1860 will signal a resumption of the uptrend with 1.1879 the next target. This is a possible trigger point for an acceleration to the upside with the next major target coming in at 1.2033.
The main range is 1.2092 to 1.1553. Its retracement zone at 1.1823 to 1.1886 stopped the rally on Wednesday at 1.1860.
The short-term range is 1.1553 to 1.1860. If the selling pressure continues then its retracement zone at 1.1707 to 1.1670 is the primary downside target. A major 50% level at 1.1702 falls inside this zone.
The best downside target is the price cluster at 1.1707 to 1.1702. Since the main trend is up, we could see a technical bounce on the first test of this area.
Daily Technical Forecast
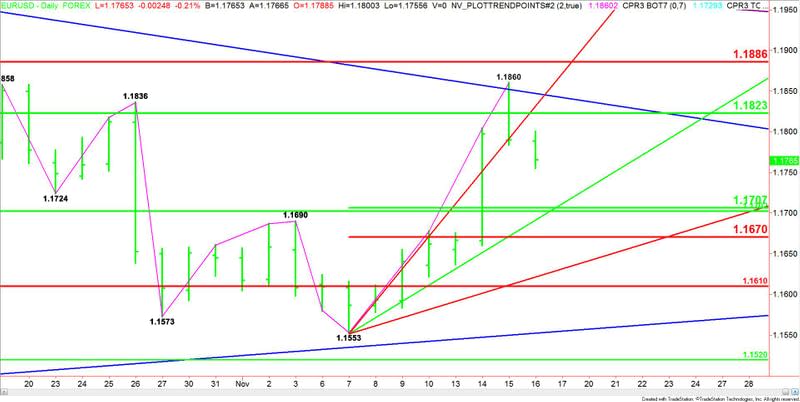
Based on the early price action, the resistance is a 50% level at 1.1823, followed by a long-term downtrending angle at 1.1847. This is followed by yesterday’s high at 1.1860 and the main Fibonacci level at 1.1886.
If the downside momentum continues then the best target is the price cluster created by a pair of 50% levels and an uptrending angle at 1.1707, 1.1702 and 1.1693 respectively.
Basically, we’re looking at a market trapped between a pair of 50% levels. On the upside, the resistance is 1.1823. On the downside, the target is 1.1707 to 1.1702.
This article was originally posted on FX Empire
More From FXEMPIRE:
Getting Back to Normal: Bitcoin Back Above $7,500, Bitcoin Cash Fall
U.S Investors Under Microscope, Wall Street Expected to Open Higher
E-mini S&P 500 Index (ES) Futures Technical Analysis – November 16, 2017 Forecast
E-mini NASDAQ-100 Index (NQ) Futures Technical Analysis – November 16, 2017 Forecast