
 Yahoo Finance
 EUR/USD Mid-Session Technical Analysis for November 15, 2017
The EUR/USD is trading above 1.1800 for the first time in three weeks as investors continue to pump money into European equities and a drop in U.S. bond yields which is making the U.S. Dollar a less-attractive investment.
Later today, investors will get the opportunity to react to U.S. consumer inflation data in October. It is expected to show a marginal increase in consumer prices.
Daily Technical Analysis
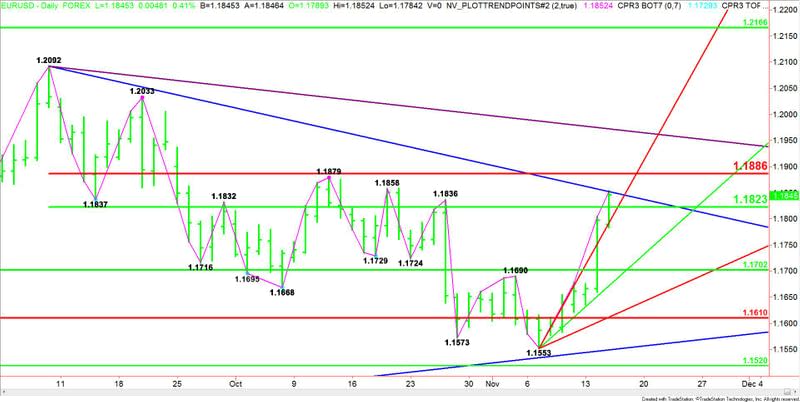
The main trend is up according to the daily swing chart. The trend turned up on Tuesday when the buying took out the previous main top at 1.1690.
The uptrend was reaffirmed earlier today when buyers took out 1.1836. If the upside momentum continues then we could see further confirmation of the rally with potential targets coming in at 1.1858 and 1.1879.
The main range is 1.2092 to 1.1553. Its retracement zone at 1.1823 to 1.1886 is currently being tested. Trader reaction to this zone will determine the longer-term direction of the market.
Daily Technical Forecast
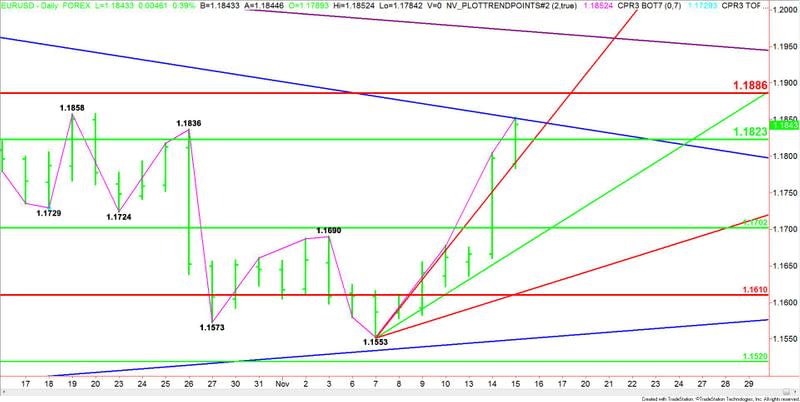
Given the current price at 1.1845 and the earlier price action, the direction of the EUR/USD the rest of the session will be determined by trader reaction to the long-term downtrending angle at 1.1852.
Taking out 1.1852 and sustaining the move will indicate the buying is getting stronger with the next target the Fibonacci level at 1.1886. This level is a potential trigger point for an acceleration to the upside with the next target angle coming in at 1.1972.
The inability to follow-through to the upside through 1.1852 will signal the presence of sellers. This could trigger a pullback into the 50% level at 1.1823 and a steep uptrending angle at 1.1793.
If 1.1793 fails as support then look out to the downside. This could trigger an acceleration into the next uptrending angle at 1.1673.
Basically, look for the bullish tone to continue on a move through 1.1852 and for a bearish tone to develop on a sustained move under 1.1793.
This article was originally posted on FX Empire
