EUR/USD Mid-Session Technical Analysis for August 3, 2020
The Euro is trading lower on Monday as a squeezing-out of crowded short U.S. Dollar positions combined with safe-haven demand is driving investors into the greenback following its weakest monthly performance in ten years.
In other news, manufacturing activity across the Euro Zone expanded for the first time since early 2019 last month as demand rebounded after more easing of the restrictions imposed to quell the spread of the new coronavirus, a survey showed on Monday.
At 12:40 GMT, the EUR/USD is trading 1.1732, down 0.0040 or -0.33%.
Factories appear to be playing their part in the recovery in the Euro Zone. IHS Markit’s final Manufacturing Purchasing Managers’ Index bounced to 51.8 in July from June’s 47.4 – its first time above the 50 mark that separates growth from contraction since January 2019. An initial “flash” release had it at 51.1.

Daily Swing Chart Technical Analysis
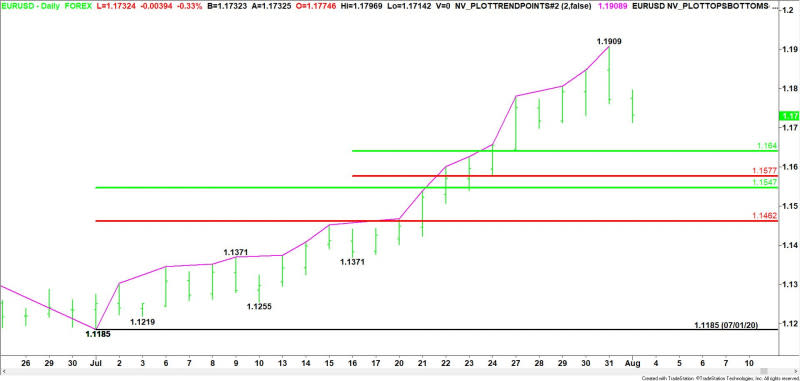
The main trend is up according to the daily swing chart. However, Friday’s closing price reversal top and subsequent follow-through to the downside has shifted momentum to the downside. This could trigger a 2 to 3 day correction of between 50% and 61.8% of the last rally.
The minor trend is also up. A trade through 1.1371 will change the minor trend to down and confirm the shift in momentum.
The minor range is 1.1371 to 1.1909. Its retracement zone at 1.1640 to 1.1577 is the first downside target zone.
The main range is 1.1185 to 1.1909. Its retracement zone at 1.1547 to 1.1462 is the primary downside target zone.
Combining the two retracement zones creates a price cluster at 1.1577 to 1.1547. This zone also represents value so it should be attractive to buyers if tested.
Daily Swing Chart Technical Forecast
The closing price reversal top is not a change in trend, but often used as a means to alleviate some of the excessive upside pressure.
Our work suggests a 2 to 3 correction is likely with 1.1640 to 1.1577 the first downside target zone. Since the main trend is up, buyers are likely to show up on a test of this level.
The EUR/USD should hit 1.1640 to 1.1577 if the downside momentum continues. If the downside momentum pauses or shifts back up then look for a retracement of the first leg down. This price is approximately 1.1812.
For a look at all of today’s economic events, check out our economic calendar.
This article was originally posted on FX Empire

 Yahoo Finance