
 Yahoo Finance
 EUR/USD Mid-Session Technical Analysis for November 19, 2019
The Euro is trading slightly better against the U.S. Dollar on Tuesday, but inside yesterday’s trading range. The price action suggests investor indecision and impending volatility. Helping to support the Euro the last three sessions has been optimism over the progress of U.S.-China trade talks. Putting a lid on prices today, however, is a report from CNBC late Tuesday that dampened trader confidence.
At 14:21 GMT, the EUR/USD is trading 1.1079, up 0.0006 or +0.05%.
Low volume is also hindering the price action. Many of the major currency players are heading to the sidelines ahead of the release of the minutes of the U.S. Federal Reserve’s monetary policy meeting from October 30 on Wednesday at 19:00 GMT.
Daily Technical Analysis
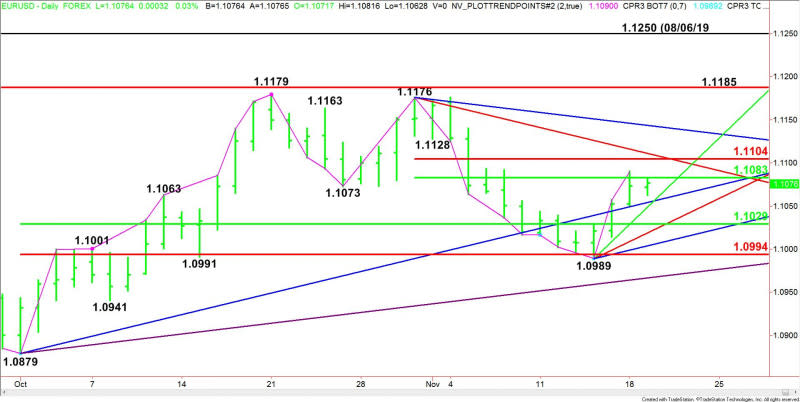
The main trend is down according to the daily swing chart, however, momentum shifted to the upside with the formation of the closing price reversal bottom on November 14 at 1.0989.
A trade through 1.0989 will negate the closing price reversal bottom and signal a resumption of the downtrend. The main trend will change to up on a trade through 1.1176.
The main range is 1.0879 to 1.1179. Its retracement zone at 1.1029 to 1.0994 is support. This zone stopped the selling at 1.0989.
The short-term range is 1.1176 to 1.0989. Its retracement zone at 1.1083 to 1.1104 is the first upside target. It stopped the rally on Monday at 1.1090.
Trader reaction to the short-term retracement zone will determine the near-term direction of the EUR/USD. Trend traders are going to try to stop the rally in an effort to form a secondary lower top. Buyers are going to try to take out this zone in an effort to generate enough upside momentum to challenge the tops at 1.1176 and 1.1179.
Daily Technical Forecast
Based on the early price action and the current price at 1.1079, the direction of the EUR/USD the rest of the session on Tuesday is likely to be determined by trader reaction to the short-term 50% level at 1.1083.
Bullish Scenario
A sustained move over 1.1083 will indicate the presence of buyers. The first upside target is 1.1090, followed by the short-term Fibonacci level at 1.1104 and the downtrending Gann angle at 1.1111.
The angle at 1.1111 is a potential trigger point for an acceleration to the upside.
Bearish Scenario
A sustained move under 1.1083 will signal the presence of sellers. If this creates enough downside momentum then look for the selling to possibly extend into a pair of uptrending Gann angles at 1.1054 and 1.1049.
This article was originally posted on FX Empire
More From FXEMPIRE:
Natural Gas Price Forecast – Natural Gas Markets Testing Major Support
AUD/USD Price Forecast – Australian Dollar All Over The Place After Rba Meeting Minutes
GBP/JPY Price Forecast – British Pound Continues To Consolidate
EUR/USD Price Forecast – Euro Continues To Grind Towards Resistance
Natural Gas Price Fundamental Daily Forecast – Latest Forecasts Offer Little Comfort for Bulls
