
 Yahoo Finance
 Euromoney Institutional Investor (LON:ERM) Shareholders Booked A 29% Gain In The Last Three Years

By buying an index fund, investors can approximate the average market return. But if you choose individual stocks with prowess, you can make superior returns. For example, Euromoney Institutional Investor PLC (LON:ERM) shareholders have seen the share price rise 29% over three years, well in excess of the market return (8.8%, not including dividends). However, more recent returns haven't been as impressive as that, with the stock returning just 8.3% in the last year , including dividends .
See our latest analysis for Euromoney Institutional Investor
In his essay The Superinvestors of Graham-and-Doddsville Warren Buffett described how share prices do not always rationally reflect the value of a business. One imperfect but simple way to consider how the market perception of a company has shifted is to compare the change in the earnings per share (EPS) with the share price movement.
During three years of share price growth, Euromoney Institutional Investor achieved compound earnings per share growth of 2.6% per year. This EPS growth is lower than the 9.0% average annual increase in the share price. This indicates that the market is feeling more optimistic on the stock, after the last few years of progress. It's not unusual to see the market 're-rate' a stock, after a few years of growth.
The graphic below depicts how EPS has changed over time (unveil the exact values by clicking on the image).
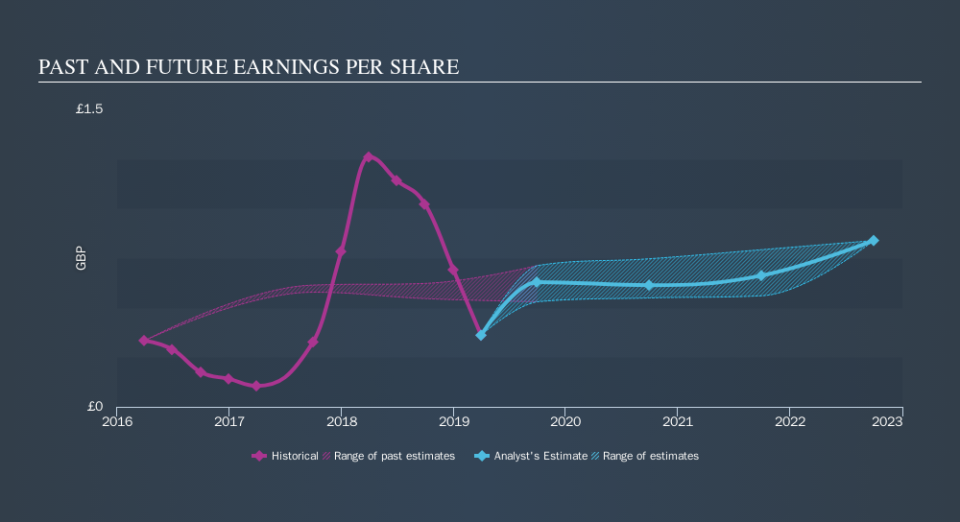
This free interactive report on Euromoney Institutional Investor's earnings, revenue and cash flow is a great place to start, if you want to investigate the stock further.
What About Dividends?
As well as measuring the share price return, investors should also consider the total shareholder return (TSR). Whereas the share price return only reflects the change in the share price, the TSR includes the value of dividends (assuming they were reinvested) and the benefit of any discounted capital raising or spin-off. Arguably, the TSR gives a more comprehensive picture of the return generated by a stock. As it happens, Euromoney Institutional Investor's TSR for the last 3 years was 39%, which exceeds the share price return mentioned earlier. And there's no prize for guessing that the dividend payments largely explain the divergence!
A Different Perspective
It's nice to see that Euromoney Institutional Investor shareholders have received a total shareholder return of 8.3% over the last year. That's including the dividend. That gain is better than the annual TSR over five years, which is 6.9%. Therefore it seems like sentiment around the company has been positive lately. Given the share price momentum remains strong, it might be worth taking a closer look at the stock, lest you miss an opportunity. Before deciding if you like the current share price, check how Euromoney Institutional Investor scores on these 3 valuation metrics.
If you would prefer to check out another company -- one with potentially superior financials -- then do not miss this free list of companies that have proven they can grow earnings.
Please note, the market returns quoted in this article reflect the market weighted average returns of stocks that currently trade on GB exchanges.
We aim to bring you long-term focused research analysis driven by fundamental data. Note that our analysis may not factor in the latest price-sensitive company announcements or qualitative material.
If you spot an error that warrants correction, please contact the editor at editorial-team@simplywallst.com. This article by Simply Wall St is general in nature. It does not constitute a recommendation to buy or sell any stock, and does not take account of your objectives, or your financial situation. Simply Wall St has no position in the stocks mentioned. Thank you for reading.
