
 Yahoo Finance
 Has Euromoney Institutional Investor PLC (LON:ERM) Improved Earnings In Recent Times?

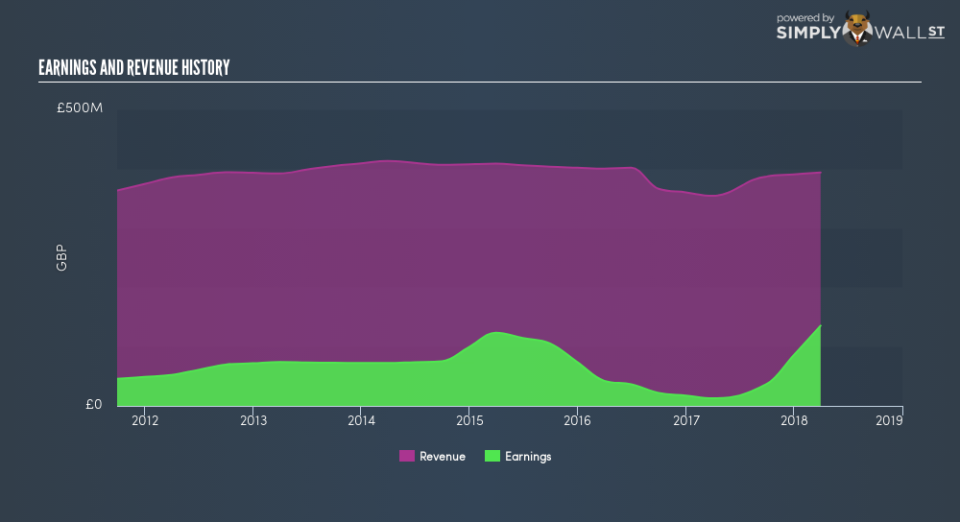
After reading Euromoney Institutional Investor PLC’s (LON:ERM) latest earnings update (31 March 2018), I found it beneficial to look back at how the company has performed in the past and compare this against the most recent numbers. As a long-term investor I tend to pay attention to earnings trend, rather than a single number at one point in time. I also like to compare against an industry benchmark to understand whether ERM has outperformed, or whether it is simply riding an industry wave. Below is a brief commentary on my key takeaways.
View our latest analysis for Euromoney Institutional Investor
Did ERM’s recent earnings growth beat the long-term trend and the industry?
ERM’s trailing twelve-month earnings (from 31 March 2018) of UK£135.3m has more than doubled from UK£22.1m in the prior year. Furthermore, this one-year growth rate has exceeded its 5-year annual growth average of 0.3%, indicating the rate at which ERM is growing has accelerated. What’s the driver of this growth? Well, let’s take a look at whether it is only because of an industry uplift, or if Euromoney Institutional Investor has experienced some company-specific growth.
In the last couple of years, Euromoney Institutional Investor grew bottom-line, while its top-line fell, by efficiently managing its costs. This brought about to a margin expansion and profitability over time. Looking at growth from a sector-level, the UK media industry has been growing its average earnings by double-digit 29.7% over the past twelve months, and 11.1% over the past five. This growth is a median of profitable companies of 24 Media companies in GB including Aeorema Communications, System1 Group and Ebiquity. This means that whatever uplift the industry is gaining from, Euromoney Institutional Investor is capable of leveraging this to its advantage.
In terms of returns from investment, Euromoney Institutional Investor has invested its equity funds well leading to a 36.5% return on equity (ROE), above the sensible minimum of 20%. Furthermore, its return on assets (ROA) of 18.0% exceeds the GB Media industry of 4.8%, indicating Euromoney Institutional Investor has used its assets more efficiently. However, its return on capital (ROC), which also accounts for Euromoney Institutional Investor’s debt level, has declined over the past 3 years from 21.0% to 13.6%. This correlates with an increase in debt holding, with debt-to-equity ratio rising from 17.5% to 29.7% over the past 5 years.
What does this mean?
Euromoney Institutional Investor’s track record can be a valuable insight into its earnings performance, but it certainly doesn’t tell the whole story. Companies that have performed well in the past, such as Euromoney Institutional Investor gives investors conviction. However, the next step would be to assess whether the future looks as optimistic. I recommend you continue to research Euromoney Institutional Investor to get a better picture of the stock by looking at:
Future Outlook: What are well-informed industry analysts predicting for ERM’s future growth? Take a look at our free research report of analyst consensus for ERM’s outlook.
Financial Health: Are ERM’s operations financially sustainable? Balance sheets can be hard to analyze, which is why we’ve done it for you. Check out our financial health checks here.
Other High-Performing Stocks: Are there other stocks that provide better prospects with proven track records? Explore our free list of these great stocks here.
NB: Figures in this article are calculated using data from the trailing twelve months from 31 March 2018. This may not be consistent with full year annual report figures.
To help readers see past the short term volatility of the financial market, we aim to bring you a long-term focused research analysis purely driven by fundamental data. Note that our analysis does not factor in the latest price-sensitive company announcements.
The author is an independent contributor and at the time of publication had no position in the stocks mentioned. For errors that warrant correction please contact the editor at editorial-team@simplywallst.com.
