
 Yahoo Finance
 Even after rising 12% this past week, thyssenkrupp (ETR:TKA) shareholders are still down 67% over the past five years
thyssenkrupp AG (ETR:TKA) shareholders should be happy to see the share price up 15% in the last month. But that is little comfort to those holding over the last half decade, sitting on a big loss. The share price has failed to impress anyone , down a sizable 68% during that time. Some might say the recent bounce is to be expected after such a bad drop. However, in the best case scenario (far from fait accompli), this improved performance might be sustained.
Although the past week has been more reassuring for shareholders, they're still in the red over the last five years, so let's see if the underlying business has been responsible for the decline.
Check out our latest analysis for thyssenkrupp
To quote Buffett, 'Ships will sail around the world but the Flat Earth Society will flourish. There will continue to be wide discrepancies between price and value in the marketplace...' One imperfect but simple way to consider how the market perception of a company has shifted is to compare the change in the earnings per share (EPS) with the share price movement.
thyssenkrupp became profitable within the last five years. Most would consider that to be a good thing, so it's counter-intuitive to see the share price declining. Other metrics might give us a better handle on how its value is changing over time.
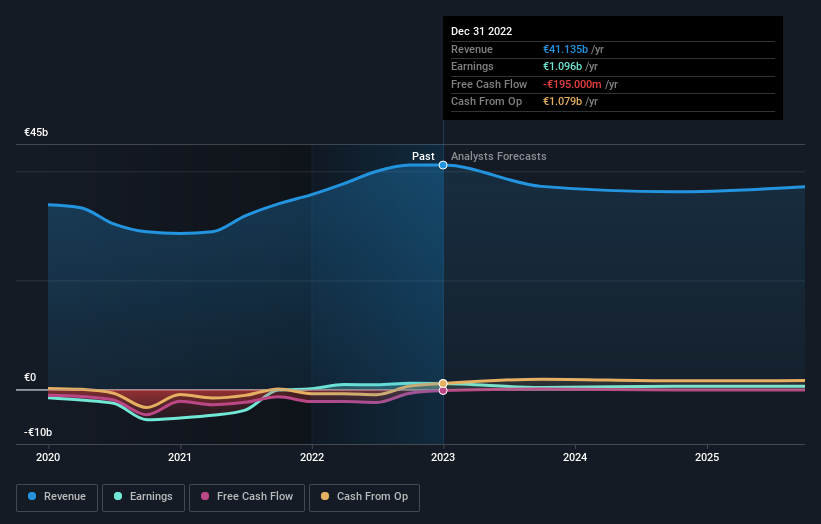
In contrast to the share price, revenue has actually increased by 0.0001% a year in the five year period. So it seems one might have to take closer look at the fundamentals to understand why the share price languishes. After all, there may be an opportunity.
You can see below how earnings and revenue have changed over time (discover the exact values by clicking on the image).
It is of course excellent to see how thyssenkrupp has grown profits over the years, but the future is more important for shareholders. This free interactive report on thyssenkrupp's balance sheet strength is a great place to start, if you want to investigate the stock further.
A Different Perspective
We're pleased to report that thyssenkrupp shareholders have received a total shareholder return of 5.2% over one year. That's including the dividend. That certainly beats the loss of about 11% per year over the last half decade. This makes us a little wary, but the business might have turned around its fortunes. I find it very interesting to look at share price over the long term as a proxy for business performance. But to truly gain insight, we need to consider other information, too. For example, we've discovered 3 warning signs for thyssenkrupp (1 is a bit unpleasant!) that you should be aware of before investing here.
But note: thyssenkrupp may not be the best stock to buy. So take a peek at this free list of interesting companies with past earnings growth (and further growth forecast).
Please note, the market returns quoted in this article reflect the market weighted average returns of stocks that currently trade on German exchanges.
Have feedback on this article? Concerned about the content? Get in touch with us directly. Alternatively, email editorial-team (at) simplywallst.com.
This article by Simply Wall St is general in nature. We provide commentary based on historical data and analyst forecasts only using an unbiased methodology and our articles are not intended to be financial advice. It does not constitute a recommendation to buy or sell any stock, and does not take account of your objectives, or your financial situation. We aim to bring you long-term focused analysis driven by fundamental data. Note that our analysis may not factor in the latest price-sensitive company announcements or qualitative material. Simply Wall St has no position in any stocks mentioned.
Join A Paid User Research Session
You’ll receive a US$30 Amazon Gift card for 1 hour of your time while helping us build better investing tools for the individual investors like yourself. Sign up here
