
 Yahoo Finance
 Even after rising 3.7% this past week, Rapid7 (NASDAQ:RPD) shareholders are still down 43% over the past three years
Many investors define successful investing as beating the market average over the long term. But in any portfolio, there are likely to be some stocks that fall short of that benchmark. We regret to report that long term Rapid7, Inc. (NASDAQ:RPD) shareholders have had that experience, with the share price dropping 43% in three years, versus a market return of about 16%. Furthermore, it's down 20% in about a quarter. That's not much fun for holders.
The recent uptick of 3.7% could be a positive sign of things to come, so let's take a look at historical fundamentals.
View our latest analysis for Rapid7
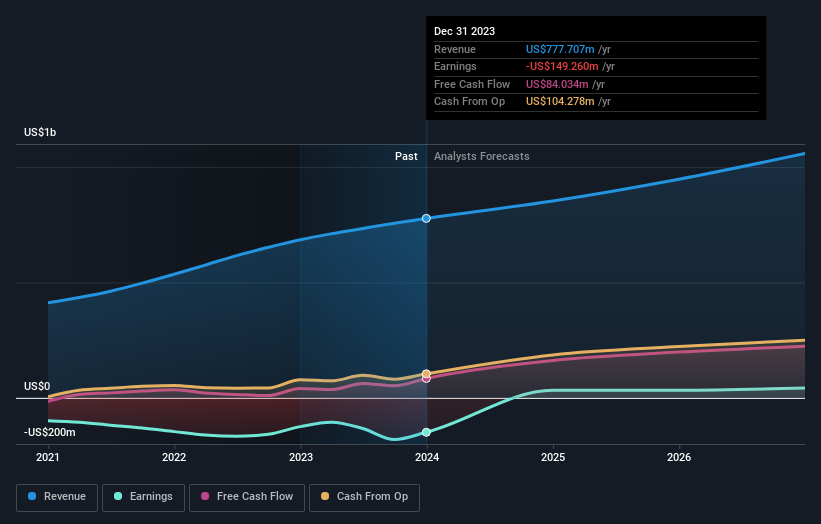
Given that Rapid7 didn't make a profit in the last twelve months, we'll focus on revenue growth to form a quick view of its business development. When a company doesn't make profits, we'd generally hope to see good revenue growth. That's because fast revenue growth can be easily extrapolated to forecast profits, often of considerable size.
Over three years, Rapid7 grew revenue at 22% per year. That is faster than most pre-profit companies. While its revenue increased, the share price dropped at a rate of 13% per year. That seems like an unlucky result for holders. It seems likely that actual growth fell short of shareholders' expectations. Still, with high hopes now tempered, now might prove to be an opportunity to buy.
You can see how earnings and revenue have changed over time in the image below (click on the chart to see the exact values).
Rapid7 is a well known stock, with plenty of analyst coverage, suggesting some visibility into future growth. So we recommend checking out this free report showing consensus forecasts
A Different Perspective
Investors in Rapid7 had a tough year, with a total loss of 5.5%, against a market gain of about 24%. Even the share prices of good stocks drop sometimes, but we want to see improvements in the fundamental metrics of a business, before getting too interested. Regrettably, last year's performance caps off a bad run, with the shareholders facing a total loss of 2% per year over five years. Generally speaking long term share price weakness can be a bad sign, though contrarian investors might want to research the stock in hope of a turnaround. I find it very interesting to look at share price over the long term as a proxy for business performance. But to truly gain insight, we need to consider other information, too. For example, we've discovered 3 warning signs for Rapid7 (1 shouldn't be ignored!) that you should be aware of before investing here.
Of course Rapid7 may not be the best stock to buy. So you may wish to see this free collection of growth stocks.
Please note, the market returns quoted in this article reflect the market weighted average returns of stocks that currently trade on American exchanges.
Have feedback on this article? Concerned about the content? Get in touch with us directly. Alternatively, email editorial-team (at) simplywallst.com.
This article by Simply Wall St is general in nature. We provide commentary based on historical data and analyst forecasts only using an unbiased methodology and our articles are not intended to be financial advice. It does not constitute a recommendation to buy or sell any stock, and does not take account of your objectives, or your financial situation. We aim to bring you long-term focused analysis driven by fundamental data. Note that our analysis may not factor in the latest price-sensitive company announcements or qualitative material. Simply Wall St has no position in any stocks mentioned.
