
 Yahoo Finance
 Everyman Media Group (LON:EMAN) Might Be Having Difficulty Using Its Capital Effectively
There are a few key trends to look for if we want to identify the next multi-bagger. Amongst other things, we'll want to see two things; firstly, a growing return on capital employed (ROCE) and secondly, an expansion in the company's amount of capital employed. Ultimately, this demonstrates that it's a business that is reinvesting profits at increasing rates of return. Although, when we looked at Everyman Media Group (LON:EMAN), it didn't seem to tick all of these boxes.
What Is Return On Capital Employed (ROCE)?
If you haven't worked with ROCE before, it measures the 'return' (pre-tax profit) a company generates from capital employed in its business. The formula for this calculation on Everyman Media Group is:
Return on Capital Employed = Earnings Before Interest and Tax (EBIT) ÷ (Total Assets - Current Liabilities)
0.0016 = UK£247k ÷ (UK£172m - UK£19m) (Based on the trailing twelve months to December 2022).
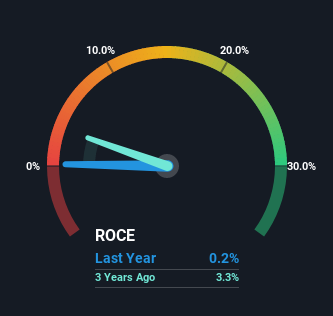
Thus, Everyman Media Group has an ROCE of 0.2%. In absolute terms, that's a low return and it also under-performs the Entertainment industry average of 14%.
View our latest analysis for Everyman Media Group
In the above chart we have measured Everyman Media Group's prior ROCE against its prior performance, but the future is arguably more important. If you'd like, you can check out the forecasts from the analysts covering Everyman Media Group here for free.
How Are Returns Trending?
In terms of Everyman Media Group's historical ROCE movements, the trend isn't fantastic. Over the last five years, returns on capital have decreased to 0.2% from 2.5% five years ago. Although, given both revenue and the amount of assets employed in the business have increased, it could suggest the company is investing in growth, and the extra capital has led to a short-term reduction in ROCE. If these investments prove successful, this can bode very well for long term stock performance.
Our Take On Everyman Media Group's ROCE
Even though returns on capital have fallen in the short term, we find it promising that revenue and capital employed have both increased for Everyman Media Group. Despite these promising trends, the stock has collapsed 73% over the last five years, so there could be other factors hurting the company's prospects. Regardless, reinvestment can pay off in the long run, so we think astute investors may want to look further into this stock.
One final note, you should learn about the 3 warning signs we've spotted with Everyman Media Group (including 1 which doesn't sit too well with us) .
If you want to search for solid companies with great earnings, check out this free list of companies with good balance sheets and impressive returns on equity.
Have feedback on this article? Concerned about the content? Get in touch with us directly. Alternatively, email editorial-team (at) simplywallst.com.
This article by Simply Wall St is general in nature. We provide commentary based on historical data and analyst forecasts only using an unbiased methodology and our articles are not intended to be financial advice. It does not constitute a recommendation to buy or sell any stock, and does not take account of your objectives, or your financial situation. We aim to bring you long-term focused analysis driven by fundamental data. Note that our analysis may not factor in the latest price-sensitive company announcements or qualitative material. Simply Wall St has no position in any stocks mentioned.
Join A Paid User Research Session
You’ll receive a US$30 Amazon Gift card for 1 hour of your time while helping us build better investing tools for the individual investors like yourself. Sign up here
