
 Yahoo Finance
 EVI Industries, Inc. (NYSEMKT:EVI) Might Not Be A Great Investment

Today we'll look at EVI Industries, Inc. (NYSEMKT:EVI) and reflect on its potential as an investment. In particular, we'll consider its Return On Capital Employed (ROCE), as that can give us insight into how profitably the company is able to employ capital in its business.
First, we'll go over how we calculate ROCE. Second, we'll look at its ROCE compared to similar companies. Finally, we'll look at how its current liabilities affect its ROCE.
What is Return On Capital Employed (ROCE)?
ROCE measures the 'return' (pre-tax profit) a company generates from capital employed in its business. Generally speaking a higher ROCE is better. Ultimately, it is a useful but imperfect metric. Renowned investment researcher Michael Mauboussin has suggested that a high ROCE can indicate that 'one dollar invested in the company generates value of more than one dollar'.
How Do You Calculate Return On Capital Employed?
Analysts use this formula to calculate return on capital employed:
Return on Capital Employed = Earnings Before Interest and Tax (EBIT) ÷ (Total Assets - Current Liabilities)
Or for EVI Industries:
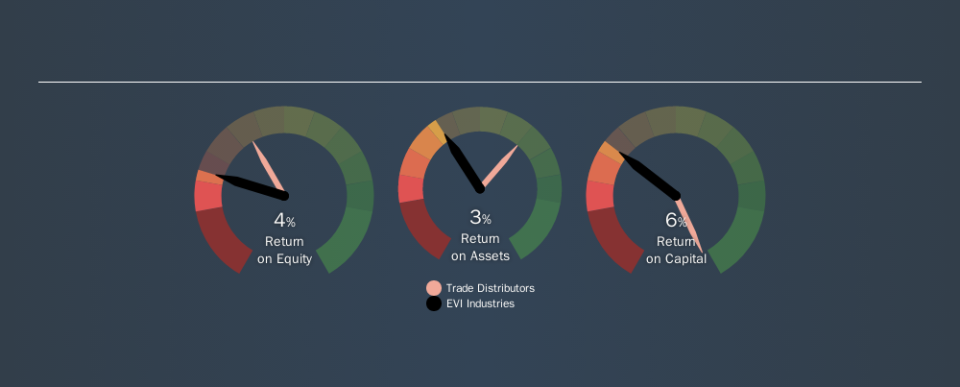
0.057 = US$7.0m ÷ (US$155m - US$32m) (Based on the trailing twelve months to March 2019.)
So, EVI Industries has an ROCE of 5.7%.
See our latest analysis for EVI Industries
Is EVI Industries's ROCE Good?
ROCE can be useful when making comparisons, such as between similar companies. Using our data, EVI Industries's ROCE appears to be significantly below the 8.8% average in the Trade Distributors industry. This could be seen as a negative, as it suggests some competitors may be employing their capital more efficiently. Separate from how EVI Industries stacks up against its industry, its ROCE in absolute terms is mediocre; relative to the returns on government bonds. It is possible that there are more rewarding investments out there.
EVI Industries's current ROCE of 5.7% is lower than 3 years ago, when the company reported a 55% ROCE. So investors might consider if it has had issues recently. You can click on the image below to see (in greater detail) how EVI Industries's past growth compares to other companies.
Remember that this metric is backwards looking - it shows what has happened in the past, and does not accurately predict the future. Companies in cyclical industries can be difficult to understand using ROCE, as returns typically look high during boom times, and low during busts. ROCE is, after all, simply a snap shot of a single year. If EVI Industries is cyclical, it could make sense to check out this free graph of past earnings, revenue and cash flow.
Do EVI Industries's Current Liabilities Skew Its ROCE?
Liabilities, such as supplier bills and bank overdrafts, are referred to as current liabilities if they need to be paid within 12 months. Due to the way the ROCE equation works, having large bills due in the near term can make it look as though a company has less capital employed, and thus a higher ROCE than usual. To counter this, investors can check if a company has high current liabilities relative to total assets.
EVI Industries has total liabilities of US$32m and total assets of US$155m. As a result, its current liabilities are equal to approximately 21% of its total assets. This very reasonable level of current liabilities would not boost the ROCE by much.
Our Take On EVI Industries's ROCE
That said, EVI Industries's ROCE is mediocre, there may be more attractive investments around. You might be able to find a better investment than EVI Industries. If you want a selection of possible winners, check out this free list of interesting companies that trade on a P/E below 20 (but have proven they can grow earnings).
I will like EVI Industries better if I see some big insider buys. While we wait, check out this free list of growing companies with considerable, recent, insider buying.
We aim to bring you long-term focused research analysis driven by fundamental data. Note that our analysis may not factor in the latest price-sensitive company announcements or qualitative material.
If you spot an error that warrants correction, please contact the editor at editorial-team@simplywallst.com. This article by Simply Wall St is general in nature. It does not constitute a recommendation to buy or sell any stock, and does not take account of your objectives, or your financial situation. Simply Wall St has no position in the stocks mentioned. Thank you for reading.
