
 Yahoo Finance
 Should We Be Excited About The Trends Of Returns At Aukett Swanke Group (LON:AUK)?
What are the early trends we should look for to identify a stock that could multiply in value over the long term? Firstly, we'd want to identify a growing return on capital employed (ROCE) and then alongside that, an ever-increasing base of capital employed. If you see this, it typically means it's a company with a great business model and plenty of profitable reinvestment opportunities. In light of that, when we looked at Aukett Swanke Group (LON:AUK) and its ROCE trend, we weren't exactly thrilled.
What is Return On Capital Employed (ROCE)?
If you haven't worked with ROCE before, it measures the 'return' (pre-tax profit) a company generates from capital employed in its business. The formula for this calculation on Aukett Swanke Group is:
Return on Capital Employed = Earnings Before Interest and Tax (EBIT) ÷ (Total Assets - Current Liabilities)
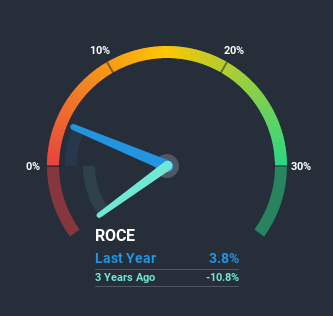
0.038 = UK£324k ÷ (UK£14m - UK£5.1m) (Based on the trailing twelve months to March 2020).
Therefore, Aukett Swanke Group has an ROCE of 3.8%. Ultimately, that's a low return and it under-performs the Professional Services industry average of 13%.
Check out our latest analysis for Aukett Swanke Group
While the past is not representative of the future, it can be helpful to know how a company has performed historically, which is why we have this chart above. If you want to delve into the historical earnings, revenue and cash flow of Aukett Swanke Group, check out these free graphs here.
What Can We Tell From Aukett Swanke Group's ROCE Trend?
In terms of Aukett Swanke Group's historical ROCE movements, the trend isn't fantastic. To be more specific, ROCE has fallen from 20% over the last five years. On the other hand, the company has been employing more capital without a corresponding improvement in sales in the last year, which could suggest these investments are longer term plays. It may take some time before the company starts to see any change in earnings from these investments.
On a side note, Aukett Swanke Group has done well to pay down its current liabilities to 37% of total assets. That could partly explain why the ROCE has dropped. Effectively this means their suppliers or short-term creditors are funding less of the business, which reduces some elements of risk. Some would claim this reduces the business' efficiency at generating ROCE since it is now funding more of the operations with its own money.
What We Can Learn From Aukett Swanke Group's ROCE
Bringing it all together, while we're somewhat encouraged by Aukett Swanke Group's reinvestment in its own business, we're aware that returns are shrinking. And investors may be expecting the fundamentals to get a lot worse because the stock has crashed 75% over the last five years. All in all, the inherent trends aren't typical of multi-baggers, so if that's what you're after, we think you might have more luck elsewhere.
On a final note, we found 5 warning signs for Aukett Swanke Group (3 are significant) you should be aware of.
While Aukett Swanke Group may not currently earn the highest returns, we've compiled a list of companies that currently earn more than 25% return on equity. Check out this free list here.
This article by Simply Wall St is general in nature. It does not constitute a recommendation to buy or sell any stock, and does not take account of your objectives, or your financial situation. We aim to bring you long-term focused analysis driven by fundamental data. Note that our analysis may not factor in the latest price-sensitive company announcements or qualitative material. Simply Wall St has no position in any stocks mentioned.
Have feedback on this article? Concerned about the content? Get in touch with us directly. Alternatively, email editorial-team (at) simplywallst.com.
