
 Yahoo Finance
 Should We Be Excited About The Trends Of Returns At Ichor Holdings (NASDAQ:ICHR)?
What are the early trends we should look for to identify a stock that could multiply in value over the long term? Typically, we'll want to notice a trend of growing return on capital employed (ROCE) and alongside that, an expanding base of capital employed. If you see this, it typically means it's a company with a great business model and plenty of profitable reinvestment opportunities. In light of that, when we looked at Ichor Holdings (NASDAQ:ICHR) and its ROCE trend, we weren't exactly thrilled.
What is Return On Capital Employed (ROCE)?
If you haven't worked with ROCE before, it measures the 'return' (pre-tax profit) a company generates from capital employed in its business. Analysts use this formula to calculate it for Ichor Holdings:
Return on Capital Employed = Earnings Before Interest and Tax (EBIT) ÷ (Total Assets - Current Liabilities)
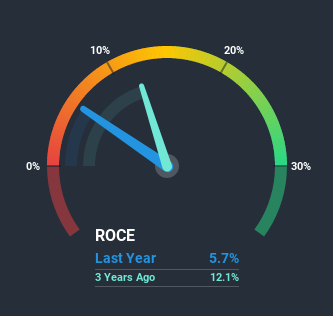
0.057 = US$35m ÷ (US$774m - US$162m) (Based on the trailing twelve months to December 2020).
Therefore, Ichor Holdings has an ROCE of 5.7%. In absolute terms, that's a low return and it also under-performs the Semiconductor industry average of 10%.
See our latest analysis for Ichor Holdings
Above you can see how the current ROCE for Ichor Holdings compares to its prior returns on capital, but there's only so much you can tell from the past. If you'd like to see what analysts are forecasting going forward, you should check out our free report for Ichor Holdings.
What Can We Tell From Ichor Holdings' ROCE Trend?
When we looked at the ROCE trend at Ichor Holdings, we didn't gain much confidence. To be more specific, ROCE has fallen from 7.7% over the last five years. Although, given both revenue and the amount of assets employed in the business have increased, it could suggest the company is investing in growth, and the extra capital has led to a short-term reduction in ROCE. And if the increased capital generates additional returns, the business, and thus shareholders, will benefit in the long run.
On a side note, Ichor Holdings has done well to pay down its current liabilities to 21% of total assets. So we could link some of this to the decrease in ROCE. Effectively this means their suppliers or short-term creditors are funding less of the business, which reduces some elements of risk. Some would claim this reduces the business' efficiency at generating ROCE since it is now funding more of the operations with its own money.
The Bottom Line On Ichor Holdings' ROCE
Even though returns on capital have fallen in the short term, we find it promising that revenue and capital employed have both increased for Ichor Holdings. And the stock has followed suit returning a meaningful 48% to shareholders over the last three years. So while the underlying trends could already be accounted for by investors, we still think this stock is worth looking into further.
One final note, you should learn about the 5 warning signs we've spotted with Ichor Holdings (including 1 which doesn't sit too well with us) .
While Ichor Holdings may not currently earn the highest returns, we've compiled a list of companies that currently earn more than 25% return on equity. Check out this free list here.
This article by Simply Wall St is general in nature. It does not constitute a recommendation to buy or sell any stock, and does not take account of your objectives, or your financial situation. We aim to bring you long-term focused analysis driven by fundamental data. Note that our analysis may not factor in the latest price-sensitive company announcements or qualitative material. Simply Wall St has no position in any stocks mentioned.
Have feedback on this article? Concerned about the content? Get in touch with us directly. Alternatively, email editorial-team (at) simplywallst.com.
