
 Yahoo Finance
 What Should We Expect From Ingenico Group – GCS’s (EPA:ING) Earnings In The Years Ahead?

The latest earnings release Ingenico Group – GCS’s (ENXTPA:ING) announced in December 2017 indicated that the business benefited from a small tailwind, leading to a single-digit earnings growth of 4.87%. Today I want to provide a brief commentary on how market analysts perceive Ingenico Group – GCS’s earnings growth outlook over the next few years and whether the future looks even brighter than the past. I will be using net income excluding extraordinary items in order to exclude one-off volatility which I am not interested in. View our latest analysis for Ingenico Group – GCS
Market analysts’ consensus outlook for the upcoming year seems rather muted, with earnings rising by a single digit 4.14%. The growth outlook in the following year seems much more optimistic with rates reaching double digit 19.06% compared to today’s earnings, and finally hitting €356.97M by 2021.
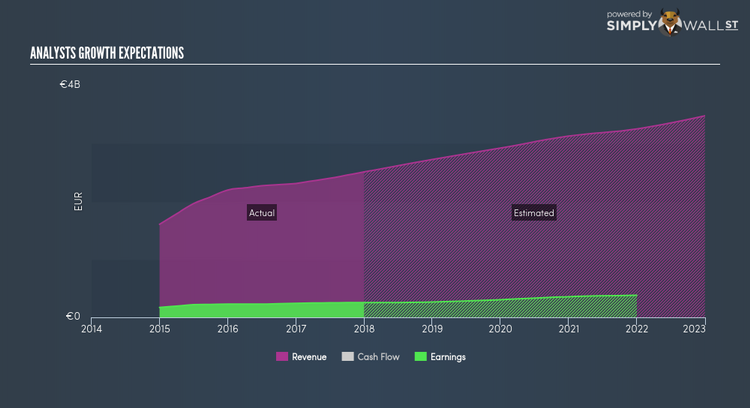
Even though it is informative understanding the growth each year relative to today’s level, it may be more insightful evaluating the rate at which the company is moving on average every year. The benefit of this method is that it ignores near term flucuations and accounts for the overarching direction of Ingenico Group – GCS’s earnings trajectory over time, which may be more relevant for long term investors. To calculate this rate, I’ve inserted a line of best fit through analyst consensus of forecasted earnings. The slope of this line is the rate of earnings growth, which in this case is 11.83%. This means, we can anticipate Ingenico Group – GCS will grow its earnings by 11.83% every year for the next few years.
Next Steps:
For Ingenico Group – GCS, I’ve put together three pertinent factors you should further research:
Financial Health: Does it have a healthy balance sheet? Take a look at our free balance sheet analysis with six simple checks on key factors like leverage and risk.
Valuation: What is ING worth today? Is the stock undervalued, even when its growth outlook is factored into its intrinsic value? The intrinsic value infographic in our free research report helps visualize whether ING is currently mispriced by the market.
Other High-Growth Alternatives: Are there other high-growth stocks you could be holding instead of ING? Explore our interactive list of stocks with large growth potential to get an idea of what else is out there you may be missing!
To help readers see pass the short term volatility of the financial market, we aim to bring you a long-term focused research analysis purely driven by fundamental data. Note that our analysis does not factor in the latest price sensitive company announcements.
The author is an independent contributor and at the time of publication had no position in the stocks mentioned.