
 Yahoo Finance
 What Should We Expect From National Grid plc's (LON:NG.) Earnings Over The Next Few Years?

Want to participate in a short research study? Help shape the future of investing tools and you could win a $250 gift card!
National Grid plc's (LON:NG.) most recent earnings announcement in March 2019 revealed that the company endured a substantial headwind with earnings falling by -58%. Below, I've laid out key numbers on how market analysts view National Grid's earnings growth outlook over the next few years and whether the future looks brighter. I will be using net income excluding extraordinary items in order to exclude one-off volatility which I am not interested in.
View our latest analysis for National Grid
Market analysts' consensus outlook for next year seems positive, with earnings increasing by a robust 32%. This growth seems to continue into the following year with rates arriving at double digit 42% compared to today’s earnings and declines to UK£2.0b by 2022.
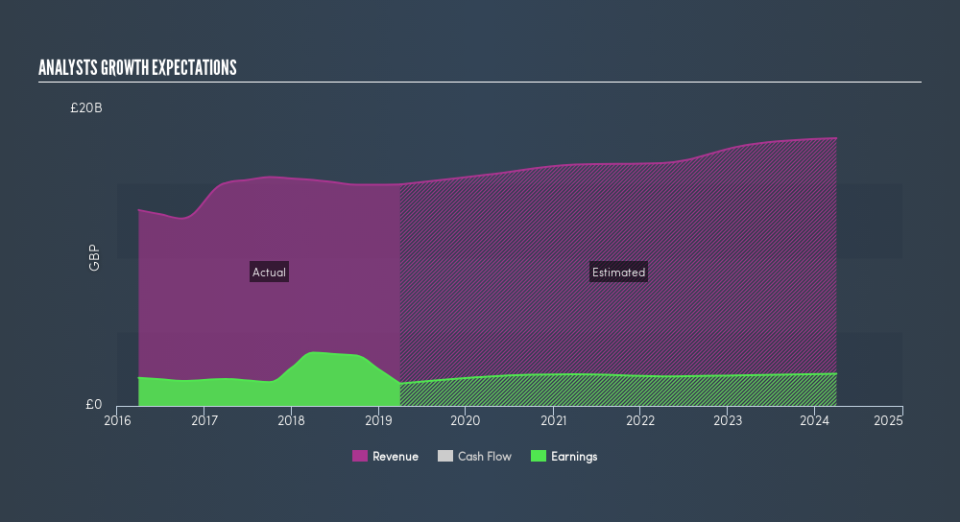
Even though it’s informative knowing the rate of growth each year relative to today’s figure, it may be more valuable evaluating the rate at which the earnings are moving on average every year. The pro of this method is that it removes the impact of near term flucuations and accounts for the overarching direction of National Grid's earnings trajectory over time, fluctuate up and down. To calculate this rate, I've inserted a line of best fit through analyst consensus of forecasted earnings. The slope of this line is the rate of earnings growth, which in this case is 4.8%. This means that, we can assume National Grid will grow its earnings by 4.8% every year for the next couple of years.
Next Steps:
For National Grid, I've compiled three fundamental factors you should further examine:
Financial Health: Does it have a healthy balance sheet? Take a look at our free balance sheet analysis with six simple checks on key factors like leverage and risk.
Management:Have insiders been ramping up their shares to take advantage of the market's sentiment for NG.'s future outlook? Check out our management and board analysis with insights on CEO compensation and governance factors.
Other High-Growth Alternatives: Are there other high-growth stocks you could be holding instead of NG.? Explore our interactive list of stocks with large growth potential to get an idea of what else is out there you may be missing!
We aim to bring you long-term focused research analysis driven by fundamental data. Note that our analysis may not factor in the latest price-sensitive company announcements or qualitative material.
If you spot an error that warrants correction, please contact the editor at editorial-team@simplywallst.com. This article by Simply Wall St is general in nature. It does not constitute a recommendation to buy or sell any stock, and does not take account of your objectives, or your financial situation. Simply Wall St has no position in the stocks mentioned. Thank you for reading.
