
 Yahoo Finance
 What Should We Expect From RSA Insurance Group plc's (LON:RSA) Earnings Over The Next Few Years?

The latest earnings release RSA Insurance Group plc's (LON:RSA) announced in December 2018 suggested that the business benefited from a strong tailwind, eventuating to a double-digit earnings growth of 21%. Below is my commentary, albeit very simple and high-level, on how market analysts predict RSA Insurance Group's earnings growth trajectory over the next few years and whether the future looks even brighter than the past. I will be looking at earnings excluding extraordinary items to exclude one-off activities to get a better understanding of the underlying drivers of earnings.
See our latest analysis for RSA Insurance Group
Market analysts' consensus outlook for the upcoming year seems optimistic, with earnings climbing by a robust 42%. This growth seems to continue into the following year with rates reaching double digit 59% compared to today’s earnings, and finally hitting UK£529m by 2022.
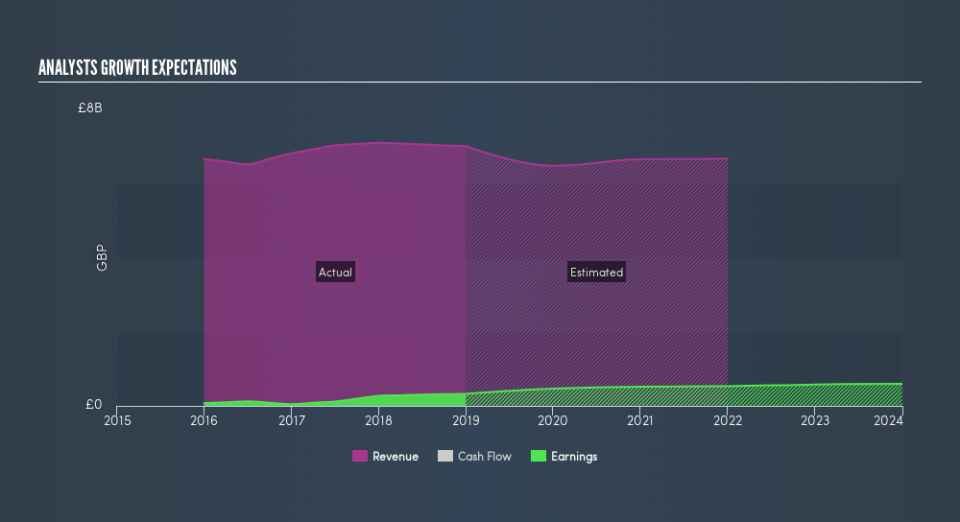
Although it’s useful to understand the growth rate year by year relative to today’s level, it may be more insightful determining the rate at which the earnings are growing on average every year. The benefit of this technique is that we can get a better picture of the direction of RSA Insurance Group's earnings trajectory over the long run, irrespective of near term fluctuations, which may be more relevant for long term investors. To calculate this rate, I've inserted a line of best fit through analyst consensus of forecasted earnings. The slope of this line is the rate of earnings growth, which in this case is 13%. This means that, we can presume RSA Insurance Group will grow its earnings by 13% every year for the next couple of years.
Next Steps:
For RSA Insurance Group, I've put together three pertinent factors you should further research:
Financial Health: Does it have a healthy balance sheet? Take a look at our free balance sheet analysis with six simple checks on key factors like leverage and risk.
Valuation: What is RSA worth today? Is the stock undervalued, even when its growth outlook is factored into its intrinsic value? The intrinsic value infographic in our free research report helps visualize whether RSA is currently mispriced by the market.
Other High-Growth Alternatives: Are there other high-growth stocks you could be holding instead of RSA? Explore our interactive list of stocks with large growth potential to get an idea of what else is out there you may be missing!
We aim to bring you long-term focused research analysis driven by fundamental data. Note that our analysis may not factor in the latest price-sensitive company announcements or qualitative material.
If you spot an error that warrants correction, please contact the editor at editorial-team@simplywallst.com. This article by Simply Wall St is general in nature. It does not constitute a recommendation to buy or sell any stock, and does not take account of your objectives, or your financial situation. Simply Wall St has no position in the stocks mentioned. Thank you for reading.
