
 Yahoo Finance
 What Should We Expect From Vonovia SE's (ETR:VNA) Earnings In The Next Couple Of Years?

Want to participate in a research study? Help shape the future of investing tools and earn a $60 gift card!
The most recent earnings announcement Vonovia SE's (ETR:VNA) released in December 2018 suggested that the company experienced a slight headwind with earnings deteriorating from €2.4b to €2.3b, a change of -6.0%. Below, I've presented key growth figures on how market analysts view Vonovia's earnings growth trajectory over the next couple of years and whether the future looks brighter. Note that I will be looking at net income excluding extraordinary items to get a better understanding of the underlying drivers of earnings.
Check out our latest analysis for Vonovia
Analysts' expectations for the upcoming year seems pessimistic, with earnings decreasing by a double-digit -18%. Beyond this, earnings are predicted to continue to be below today's level, with a decline of -17% in 2021, eventually reaching €1.9b in 2022.
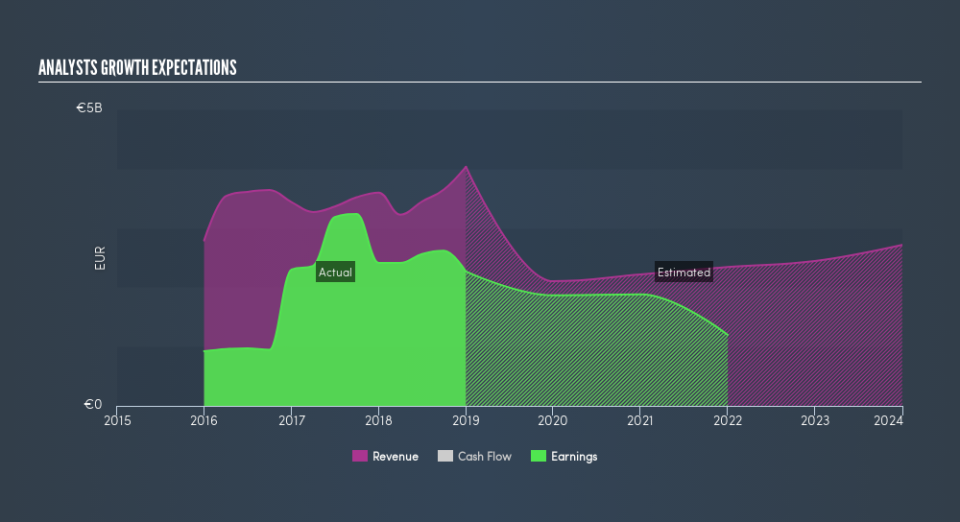
Although it is helpful to understand the rate of growth each year relative to today’s value, it may be more insightful to determine the rate at which the company is moving on average every year. The benefit of this method is that it removes the impact of near term flucuations and accounts for the overarching direction of Vonovia's earnings trajectory over time, be more volatile. To calculate this rate, I put a line of best fit through the forecasted earnings by market analysts. The slope of this line is the rate of earnings growth, which in this case is -13%. This means that, we can assume Vonovia will chip away at a rate of -13% every year for the next couple of years.
Next Steps:
For Vonovia, I've put together three key factors you should look at:
Financial Health: Does it have a healthy balance sheet? Take a look at our free balance sheet analysis with six simple checks on key factors like leverage and risk.
Future Earnings: How does VNA's growth rate compare to its peers and the wider market? Dig deeper into the analyst consensus number for the upcoming years by interacting with our free analyst growth expectation chart.
Other High-Growth Alternatives: Are there other high-growth stocks you could be holding instead of VNA? Explore our interactive list of stocks with large growth potential to get an idea of what else is out there you may be missing!
We aim to bring you long-term focused research analysis driven by fundamental data. Note that our analysis may not factor in the latest price-sensitive company announcements or qualitative material.
If you spot an error that warrants correction, please contact the editor at editorial-team@simplywallst.com. This article by Simply Wall St is general in nature. It does not constitute a recommendation to buy or sell any stock, and does not take account of your objectives, or your financial situation. Simply Wall St has no position in the stocks mentioned. Thank you for reading.
