
 Yahoo Finance
 Expedia Group (EXPE) Q1 Earnings & Revenues Beat, Rise Y/Y
Expedia Group, Inc. EXPE delivered first-quarter 2024 adjusted earnings of 21 cents per share, which compares favorably with a loss of 20 cents reported in the year-ago quarter and with the Zacks Consensus Estimate for a loss of 37 cents.
Revenues of $2.89 billion rose 8% year over year. The figure surpassed the Zacks Consensus Estimate of $2.80 billion.
Year-over-year revenue growth was driven by the solid momentum across B2B, Brand Expedia and Advertising. Strength in lodging offerings and growing momentum across non-U.S. regions contributed well.
Growing gross bookings, owing to solid momentum in the ‘booked room nights’ metric, was another positive.
However, softness in Trivago was concerning.
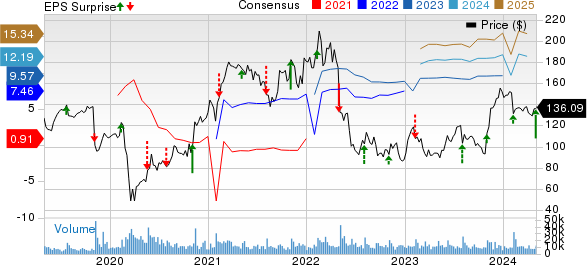
EXPE shares have lost 23.2% in a year against the Zacks Retail-Wholesale sector’s growth of 5.3%.
EXPE’s initiative to infuse generative AI technology into its services is expected to drive customer momentum by delivering an enhanced user experience.
Expedia Group, Inc. Price, Consensus and EPS Surprise
Expedia Group, Inc. price-consensus-eps-surprise-chart | Expedia Group, Inc. Quote
Top Line in Detail
Revenues by Segment
B2C: Expedia generated $1.99 billion in revenues (69% of the total revenues) from the segment, growing 3.4% year over year.
B2B: The segment yielded revenues of $833 million (29% of the total revenues), up 24.7% from the year-ago quarter.
Trivago: Revenues from the segment totaled $70 million (2% of the total revenues), down 7.9% year over year.
Revenues by Region
Expedia generated $1.8 billion in revenues (62.1% of the total revenues) from U.S. points of sale, up 2.6% from the prior-year quarter.
Revenues generated by non-U.S. points of sale totaled $1.1 billion (37.9% of the total revenues), up 19.5% on a year-over-year basis.
Revenues by Product Line
Lodging revenues were $2.23 billion, accounting for 77.1% of the total revenues. EXPE witnessed 9.8% growth in Lodging revenues on a year-over-year basis.
Air revenues were $115 million, representing 4% of the total revenues. EXPE witnessed 1.8% growth in Air revenues. Nevertheless, the company experienced 3% year-over-year growth in ‘booked air tickets.’
Advertising and media for Expedia Group generated revenues of $145 million, up 46.5% from the prior-year quarter. The figure accounted for 5% of the total revenues.
Advertising and media for trivago generated revenues of $70 million, down 7.9% from the prior-year quarter. The figure accounted for 2.4% of the total revenues.
Other revenues were $331 million (11.5% of the total revenues), down 4.9% year over year.
Gross Bookings
Expedia’s gross bookings were $30.2 billion, which increased 3% year over year. The reported figure missed the Zacks Consensus Estimate of $30.6 billion.
Agency’s gross bookings were $13.3 billion (44.1% of gross bookings), down 0.9% year over year. The figure lagged the consensus mark of $13.4 billion.
Merchant’s gross bookings were $16.9 billion (55.9%), up 5.6% from the prior-year quarter’s figure. The figure lagged the consensus mark of $17.2 billion.
Lodging gross bookings grew 4% year over year in the reported quarter.
Strength in ‘booked room nights,’ which rose 7% from the year-ago quarter, was a positive.
Operating Details
Adjusted EBITDA was $255 million in the reported quarter, up 38% from the year-ago quarter.
Selling and marketing expenses (direct and indirect) were $1.84 billion, up 9.7% year over year. As a percentage of revenues, the figure expanded 80 basis points (bps) year over year.
General and administrative expenses were $186 million, up 1.1% year over year. The figure contracted 50 bps year over year as a percentage of revenues.
Technology and content expenses were $341 million, up 7.6% from the year-ago quarter. The figure contracted 10 bps from the year-ago quarter as a percentage of revenues.
EXPE reported a first-quarter operating loss of $110 million compared with a loss of $121 million reported in the year-ago quarter.
Balance Sheet & Cash Flow
As of Dec 31, 2023, cash and cash equivalents and short-term investments were $5.71 billion, up from $4.25 billion as of Dec 31, 2023.
Long-term debt was $6.256 billion at the end of the first quarter compared with $6.253 billion at the end of the fourth quarter.
Expedia generated $2.9 billion of cash from operations in the reported quarter against $238 million of cash it used in operations in the previous quarter.
Zacks Rank & Stocks to Consider
Currently, Expedia carries a Zacks Rank #3 (Hold).
Some better-ranked stocks in the retail-wholesale sector are The Gap GPS, DICK'S Sporting Goods DKS and Target TGT, each carrying a Zacks Rank #2 (Buy) at present. You can see the complete list of today’s Zacks #1 Rank (Strong Buy) stocks here.
The Gap has lost 3.9% in the year-to-date period. The long-term earnings growth rate for GPS is estimated at 12%.
DICK'S Sporting Goods shares have gained 41.2% in the year-to-date period. DKS’s long-term earnings growth rate is projected at 35.5%.
Target has gained 11.5% in the year-to-date period. The long-term earnings growth rate for TGT is anticipated at 11.36%.
Want the latest recommendations from Zacks Investment Research? Today, you can download 7 Best Stocks for the Next 30 Days. Click to get this free report
Target Corporation (TGT) : Free Stock Analysis Report
Expedia Group, Inc. (EXPE) : Free Stock Analysis Report
The Gap, Inc. (GPS) : Free Stock Analysis Report
DICK'S Sporting Goods, Inc. (DKS) : Free Stock Analysis Report
