
 Yahoo Finance
 Exploring Top Dividend Stocks In The UK For May 2024
As of May 2024, the UK market is closely monitoring key economic indicators such as inflation and public finance figures, reflecting a cautious optimism among investors. Amidst this backdrop, focusing on dividend stocks could be a prudent strategy for those looking to navigate the complexities of the current financial climate.
Top 10 Dividend Stocks In The United Kingdom
Name | Dividend Yield | Dividend Rating |
Record (LSE:REC) | 7.72% | ★★★★★★ |
Keller Group (LSE:KLR) | 3.39% | ★★★★★☆ |
Dunelm Group (LSE:DNLM) | 7.34% | ★★★★★☆ |
DCC (LSE:DCC) | 3.37% | ★★★★★☆ |
Plus500 (LSE:PLUS) | 5.78% | ★★★★★☆ |
Big Yellow Group (LSE:BYG) | 3.68% | ★★★★★☆ |
Grafton Group (LSE:GFTU) | 3.65% | ★★★★★☆ |
Rio Tinto Group (LSE:RIO) | 5.70% | ★★★★★☆ |
NWF Group (AIM:NWF) | 3.77% | ★★★★★☆ |
Hargreaves Services (AIM:HSP) | 6.64% | ★★★★★☆ |
Click here to see the full list of 53 stocks from our Top Dividend Stocks screener.
Underneath we present a selection of stocks filtered out by our screen.
M&G Credit Income Investment Trust
Simply Wall St Dividend Rating: ★★★★☆☆
Overview: M&G Credit Income Investment Trust plc focuses on investing in a diverse portfolio of public and private debt instruments, with a market capitalization of approximately £134.72 million.
Operations: M&G Credit Income Investment Trust plc generates its revenue primarily through investments in closed-end funds, totaling £15.36 million.
Dividend Yield: 8.3%
M&G Credit Income Investment Trust recently announced a dividend increase to £0.0215 per share, effective May 24, 2024. This adjustment reflects a positive shift in the company's financial health, as evidenced by its transition from a net loss in 2023 to reporting net income of £13.31 million at year-end. Despite this improvement and a reasonable payout ratio of 84.8%, the trust's dividend history remains relatively unstable with significant fluctuations over its brief five-year dividend-paying period. Furthermore, while the dividends are well-covered by both earnings and cash flow (57.1% cash payout ratio), the overall record shows volatility that might concern conservative dividend investors seeking stability.

Paragon Banking Group
Simply Wall St Dividend Rating: ★★★★☆☆
Overview: Paragon Banking Group PLC operates in the United Kingdom, offering a range of financial products and services, with a market capitalization of approximately £1.58 billion.
Operations: Paragon Banking Group PLC generates its revenue primarily through mortgage lending and commercial lending, with contributions of £272.80 million and £139.60 million respectively.
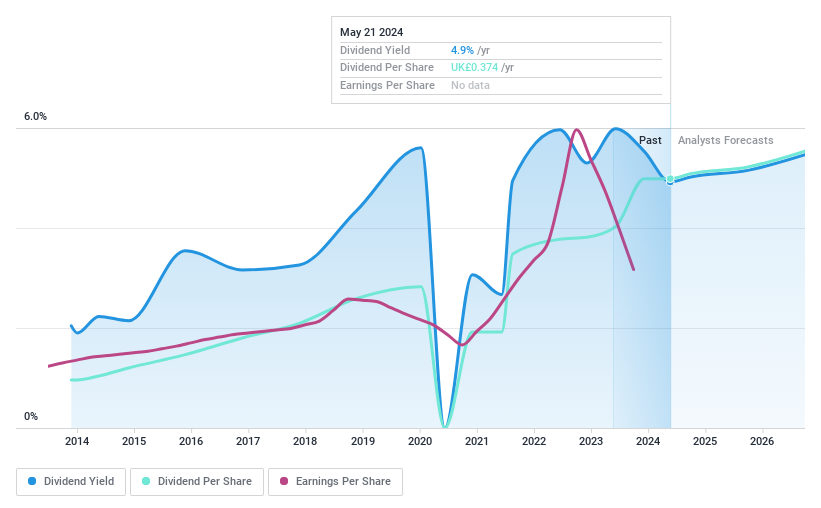
Dividend Yield: 4.9%
Paragon Banking Group's dividend yield stands at 4.92%, below the top quartile of UK dividend payers. Despite a volatile history over the past decade, dividends have shown growth and are well-supported by a sustainable payout ratio of 54.5% and a low cash payout ratio of 3.6%. However, profit margins have declined from last year's 73.5% to 39.1%. Recent executive changes, including Adam Zadora joining as Business Development Director, indicate strategic enhancements in their SME lending division.
Plus500
Simply Wall St Dividend Rating: ★★★★★☆
Overview: Plus500 Ltd. is a fintech company that provides technology-based trading platforms across Europe, the United Kingdom, Australia, and other international markets, with a market capitalization of approximately £1.77 billion.
Operations: Plus500 Ltd. generates its revenue primarily through CFD trading, amounting to $719.10 million.
Dividend Yield: 5.8%
Plus500's dividend history shows volatility, with significant drops over the past decade. Despite this, its dividends appear sustainable with a low payout ratio of 25.4% and a cash payout ratio of 38.1%, indicating good coverage by both earnings and cash flows. The dividend yield is competitive at 5.78%, placing it in the top quartile for UK stocks. However, earnings are expected to decline slightly by an average of 1% annually over the next three years.
Dive into the specifics of Plus500 here with our thorough dividend report.
Our valuation report here indicates Plus500 may be undervalued.

Next Steps
Click here to access our complete index of 53 Top Dividend Stocks.
Are these companies part of your investment strategy? Use Simply Wall St to consolidate your holdings into a portfolio and gain insights with our comprehensive analysis tools.
Discover a world of investment opportunities with Simply Wall St's free app and access unparalleled stock analysis across all markets.
Looking For Alternative Opportunities?
Explore high-performing small cap companies that haven't yet garnered significant analyst attention.
Fuel your portfolio with companies showing strong growth potential, backed by optimistic outlooks both from analysts and management.
Find companies with promising cash flow potential yet trading below their fair value.
This article by Simply Wall St is general in nature. We provide commentary based on historical data and analyst forecasts only using an unbiased methodology and our articles are not intended to be financial advice. It does not constitute a recommendation to buy or sell any stock, and does not take account of your objectives, or your financial situation. We aim to bring you long-term focused analysis driven by fundamental data. Note that our analysis may not factor in the latest price-sensitive company announcements or qualitative material. Simply Wall St has no position in any stocks mentioned.
Companies discussed in this article include LSE:MGCI LSE:PAG and LSE:PLUS.
Have feedback on this article? Concerned about the content? Get in touch with us directly. Alternatively, email editorial-team@simplywallst.com
