
 Yahoo Finance
 Express, Inc. (NYSE:EXPR): Time For A Financial Health Check

While small-cap stocks, such as Express, Inc. (NYSE:EXPR) with its market cap of US$308m, are popular for their explosive growth, investors should also be aware of their balance sheet to judge whether the company can survive a downturn. Evaluating financial health as part of your investment thesis is essential, since poor capital management may bring about bankruptcies, which occur at a higher rate for small-caps. Let’s work through some financial health checks you may wish to consider if you’re interested in this stock. However, these checks don’t give you a full picture, so I suggest you dig deeper yourself into EXPR here.
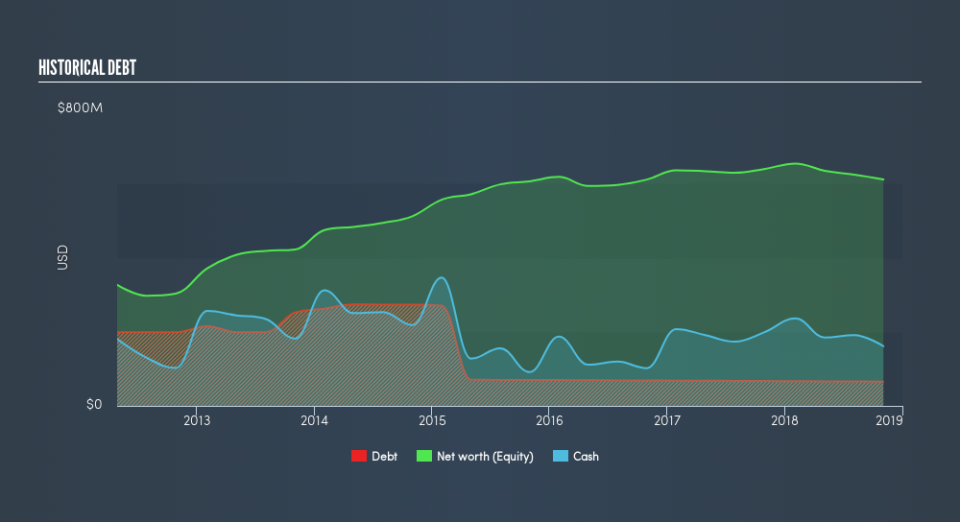
EXPR’s Debt (And Cash Flows)
Over the past year, EXPR has maintained its debt levels at around US$66m . At this stable level of debt, the current cash and short-term investment levels stands at US$161m , ready to be used for running the business. Moreover, EXPR has generated US$89m in operating cash flow in the last twelve months, leading to an operating cash to total debt ratio of 136%, indicating that EXPR’s debt is appropriately covered by operating cash.
Does EXPR’s liquid assets cover its short-term commitments?
With current liabilities at US$353m, it appears that the company has maintained a safe level of current assets to meet its obligations, with the current ratio last standing at 1.7x. The current ratio is the number you get when you divide current assets by current liabilities. Generally, for Specialty Retail companies, this is a reasonable ratio since there’s a sufficient cash cushion without leaving too much capital idle or in low-earning investments.
Does EXPR face the risk of succumbing to its debt-load?
With debt at 11% of equity, EXPR may be thought of as appropriately levered. This range is considered safe as EXPR is not taking on too much debt obligation, which may be constraining for future growth. We can test if EXPR’s debt levels are sustainable by measuring interest payments against earnings of a company. Ideally, earnings before interest and tax (EBIT) should cover net interest by at least three times. For EXPR, the ratio of 171x suggests that interest is comfortably covered, which means that lenders may be inclined to lend more money to the company, as it is seen as safe in terms of payback.
Next Steps:
EXPR’s high cash coverage and low debt levels indicate its ability to utilise its borrowings efficiently in order to generate ample cash flow. In addition to this, the company exhibits an ability to meet its near term obligations should an adverse event occur. I admit this is a fairly basic analysis for EXPR’s financial health. Other important fundamentals need to be considered alongside. I recommend you continue to research Express to get a more holistic view of the stock by looking at:
Future Outlook: What are well-informed industry analysts predicting for EXPR’s future growth? Take a look at our free research report of analyst consensus for EXPR’s outlook.
Valuation: What is EXPR worth today? Is the stock undervalued, even when its growth outlook is factored into its intrinsic value? The intrinsic value infographic in our free research report helps visualize whether EXPR is currently mispriced by the market.
Other High-Performing Stocks: Are there other stocks that provide better prospects with proven track records? Explore our free list of these great stocks here.
We aim to bring you long-term focused research analysis driven by fundamental data. Note that our analysis may not factor in the latest price-sensitive company announcements or qualitative material.
If you spot an error that warrants correction, please contact the editor at editorial-team@simplywallst.com. This article by Simply Wall St is general in nature. It does not constitute a recommendation to buy or sell any stock, and does not take account of your objectives, or your financial situation. Simply Wall St has no position in the stocks mentioned. Thank you for reading.
