
 Yahoo Finance
 F.N.B. Corp (FNB) Stock Slides 2.2% Despite Q1 Earnings Beat
F.N.B. Corporation’s FNB first-quarter 2023 adjusted earnings per share of 34 cents outpaced the Zacks Consensus Estimate by a penny. However, the bottom line reflects a decline of 15% from the prior-year quarter.
The results were primarily aided by a decline in provisions and higher non-interest income. However, lower net interest income (NII), a fall in average loans and deposits balance and an increase in expenses were the undermining factors. Probably due to these concerns, shares of the company lost 2.2% in the after-market trading following the earnings release.
After considering significant items, net income available to common stockholders was $116.3 million, down 19.5% year over year. Our estimate for the metric was $115 million.
Revenues Decline, Expenses Rise
Quarterly net revenues were $406.9 million, down 2.2% from the year-earlier quarter. The top line marginally beat the Zacks Consensus Estimate of $406.3 million.
NII was $319 million, down 5.3%. The fall was mainly due to higher deposit costs, partly offset by growth in earning assets and higher earning asset yields. Our estimate for NII was pegged at $322.1 million.
Net interest margin (FTE basis) (non-GAAP) contracted 38 basis points (bps) year over year to 3.18%.
Non-interest income was $87.9 million, up 10.7%. The improvement was driven by a rise in all fee income components except insurance commissions and fees and capital markets income. Further, the absence of net securities loss offered support. Our estimate for the metric was $81.2 million.
Non-interest expenses were $237.1 million, up 7.8% year over year. Our estimate for the same was $229.7 million. After excluding significant items impacting earnings, adjusted expenses rose 7.5% to $234.1 million.
As of Mar 31, 2024, common equity Tier 1 (CET1) ratio was 10.2% compared with 10% in the prior-year quarter.
At the end of the first quarter, average loans and leases were $32.4 billion, up marginally on a sequential basis. Average deposits totaled $34.2 billion, down slightly.
Credit Quality Improves
F.N.B. Corp’s provision for credit losses was $13.9 million, down 1.4% from the prior-year quarter. Our estimate for provisions was $24.4 million.
The ratio of non-performing loans and other real estate owned (OREO) to total loans and OREO decreased 5 bps to 0.33%. Also, net charge-offs to total average loans were 0.16%, down 2 bps.
On the other hand, total delinquency increased 4 bps to 0.64%.
Our Take
F.N.B. Corp’s solid liquidity position bodes well for the future. The company’s top line is expected to benefit from its efforts to increase fee income and opportunistic acquisitions. However, persistently rising expenses will likely hurt profits in the near term.
F.N.B. Corporation Price, Consensus and EPS Surprise
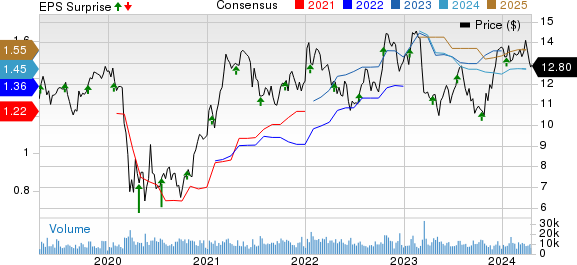
F.N.B. Corporation price-consensus-eps-surprise-chart | F.N.B. Corporation Quote
Currently, F.N.B. Corp carries a Zacks Rank #3 (Hold). You can see the complete list of today’s Zacks #1 Rank (Strong Buy) stocks here.
Performance of Other Banks
Commerce Bancshares’ CBSH first-quarter 2024 earnings per share of 86 cents surpassed the Zacks Consensus Estimate of 80 cents. However, the bottom line decreased 5.5% from the prior-year quarter.
Results benefited from a rise in non-interest income and lower provisions. Also, the company recorded a sequential improvement in loan balances in the quarter. However, a decline in NII and higher expenses were the major headwinds for CBSH.
Hancock Whitney Corp.’s HWC first-quarter 2024 adjusted earnings per share of $1.28 beat the Zacks Consensus Estimate of $1.18. However, the bottom line compared unfavorably with the $1.45 registered in the year-ago quarter.
HWC’s results were aided by an increase in non-interest income. Also, marginally higher loan balances were a tailwind. However, a decline in NII, and higher expenses and provisions were the undermining factors.
Want the latest recommendations from Zacks Investment Research? Today, you can download 7 Best Stocks for the Next 30 Days. Click to get this free report
Commerce Bancshares, Inc. (CBSH) : Free Stock Analysis Report
F.N.B. Corporation (FNB) : Free Stock Analysis Report
Hancock Whitney Corporation (HWC) : Free Stock Analysis Report
