
 Yahoo Finance
 F5 Networks (FFIV) Up 6.6% Since Earnings Report: Can It Continue?

A month has gone by since the last earnings report for F5 Networks, Inc. FFIV. Shares have added about 6.6% in the past month, outperforming the market.
Will the recent positive trend continue leading up to its next earnings release, or is FFIV due for a pullback? Before we dive into how investors and analysts have reacted as of late, let's take a quick look at the most recent earnings report in order to get a better handle on the important catalysts.
F5 Networks Q1 Earnings and Revenues Beat Estimates
F5 Networks reported first-quarter fiscal 2018 non-GAAP earnings per share (excluding amortization of intangible assets, stock-based compensation and other one-time items) of $2.26, surpassing the Zacks Consensus Estimate of $2.04 per share as well as the guidance of $2.02-$2.05. Furthermore, earnings improved from $1.98 per share reported in the year-ago quarter.
Revenues
F5 Networks’ revenues grew 1.4% year over year to $523.2 million and came ahead of the Zacks Consensus Estimate of $521.4 million. Notably, revenues were also above the mid-point of the guided range of $515-$525 million.
Revenues were boosted by a 7% increase in service revenues, which accounted for 57% of total revenues. However, product revenues witnessed a decrease of 5% on a year-over-year basis.
Geographically, on a year-over-year basis, revenues from the Americas were up 2% and contributed 56% to total revenues. EMEA increased 7% and accounted for 27% of total revenues. Asia-Pacific was down 5% on a year-over-year basis, representing 14% of total revenues. Japan revenues decreased 12% and represented 4% of total revenues.
By verticals, Enterprise, Service providers and Government (including 8% from the U.S. federal) accounted for 64%, 20% and 16% of total revenues, respectively.
The company’s distributors Ingram Micro, Tech Data, Arrow, Westcon and Cynics accounted for 15%, 12%, 11%, 10% and 11%, of total revenues, respectively.
Operating Results
F5 Networks’ non-GAAP gross profit (excluding amortization of intangible assets, other one-time items and stock-based compensation) was up 1% on a year-over-year basis and came in at $443.3 million. Non-GAAP gross margin decreased 30 basis points (bps) during the quarter and came in at 84.7%, primarily due to higher cost of sales.
The company’s non-GAAP operating margin (excluding amortization of intangible assets, other one-time items and stock-based compensation) decreased 80 bps from the year-ago quarter to 35.5%, primarily due to higher non-GAAP operating expenses as a percentage of revenues.
The company’s non-GAAP net income (excluding amortization of intangible assets, other one-time items and stock-based compensation) came in at approximately $141.6 million compared with $130.3 million reported in the year-ago quarter. On a GAAP basis, net income came in at $88.4 million compared with $94.2 million reported in the year-ago period.
Balance Sheet & Cash Flow
F5 Networks exited the quarter with cash, cash equivalents and short-term investments of approximately $1.004 billion compared with $1.017 billion in the prior quarter. Receivables were $291.1 million at the end of the quarter.
The company’s balance sheet does not have any long-term debt. It reported cash flow from operations of $190 million during the quarter. During the quarter, F5 Networks repurchased approximately 1.24 million shares for $150 million.
Guidance
For second-quarter fiscal 2018, F5 Networks expects revenues in the range of $525-$535 million. The Zacks Consensus Estimate is pegged at $528.6 million. Non-GAAP gross margin is anticipated to be roughly 84.5%. The company expects non-GAAP earnings for second-quarter fiscal 2018 in the range of $2.24-$2.27 per share. The Zacks Consensus Estimate is pegged at $2.11 per share.
How Have Estimates Been Moving Since Then?
In the past month, investors have witnessed an upward trend in fresh estimates. There have been six revisions higher for the current quarter compared to one lower. While looking back an additional 30 days, we can see even more upward momentum. In the past month, the consensus estimate has shifted by 6.27 % due to these changes.
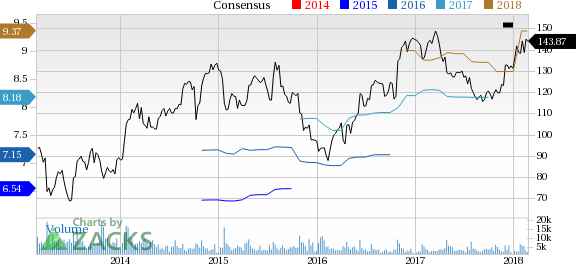
F5 Networks, Inc. Price and Consensus
F5 Networks, Inc. Price and Consensus | F5 Networks, Inc. Quote
VGM Scores
At this time, FFIV has an average Growth Score of C, however its Momentum is doing a lot better with an A. However, the stock was also allocated a grade of C on the value side, putting it in the middle 20% for this investment strategy.
Overall, the stock has an aggregate VGM Score of B. If you aren't focused on one strategy, this score is the one you should be interested in.
Based on our scores, the stock is more suitable for momentum investors than those looking for value and growth.
Outlook
Estimates have been broadly trending upward for the stock, and the magnitude of these revisions looks promising. Interestingly, FFIV has a Zacks Rank #3 (Hold). We expect an in-line return from the stock in the next few months.
Want the latest recommendations from Zacks Investment Research? Today, you can download 7 Best Stocks for the Next 30 Days. Click to get this free report
F5 Networks, Inc. (FFIV) : Free Stock Analysis Report
To read this article on Zacks.com click here.
Zacks Investment Research
