
 Yahoo Finance
 Farfetch (NYSE:FTCH) adds US$316m to market cap in the past 7 days, though investors from a year ago are still down 74%
Farfetch Limited (NYSE:FTCH) shareholders will doubtless be very grateful to see the share price up 59% in the last month. But that is meagre solace when you consider how the price has plummeted over the last year. During that time the share price has plummeted like a stone, down 74%. It's not uncommon to see a bounce after a drop like that. The important thing is whether the company can turn it around, longer term.
While the last year has been tough for Farfetch shareholders, this past week has shown signs of promise. So let's look at the longer term fundamentals and see if they've been the driver of the negative returns.
View our latest analysis for Farfetch
To paraphrase Benjamin Graham: Over the short term the market is a voting machine, but over the long term it's a weighing machine. One way to examine how market sentiment has changed over time is to look at the interaction between a company's share price and its earnings per share (EPS).
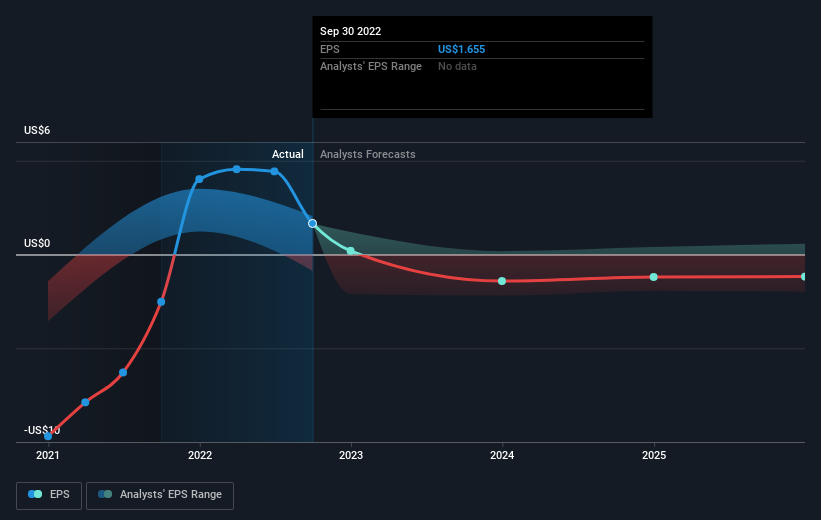
Farfetch managed to increase earnings per share from a loss to a profit, over the last 12 months.
We're surprised that the share price is lower given that improvement. If the company can sustain the earnings growth, this might be an inflection point for the business, which would make right now a really interesting time to study it more closely.
The graphic below depicts how EPS has changed over time (unveil the exact values by clicking on the image).
It is of course excellent to see how Farfetch has grown profits over the years, but the future is more important for shareholders. It might be well worthwhile taking a look at our free report on how its financial position has changed over time.
A Different Perspective
The last twelve months weren't great for Farfetch shares, which performed worse than the market, costing holders 74%. Meanwhile, the broader market slid about 13%, likely weighing on the stock. Shareholders have lost 15% per year over the last three years, so the share price drop has become steeper, over the last year; a potential symptom of as yet unsolved challenges. Although Baron Rothschild famously said to "buy when there's blood in the streets, even if the blood is your own", he also focusses on high quality stocks with solid prospects. I find it very interesting to look at share price over the long term as a proxy for business performance. But to truly gain insight, we need to consider other information, too. For instance, we've identified 3 warning signs for Farfetch (2 are a bit concerning) that you should be aware of.
If you are like me, then you will not want to miss this free list of growing companies that insiders are buying.
Please note, the market returns quoted in this article reflect the market weighted average returns of stocks that currently trade on US exchanges.
Have feedback on this article? Concerned about the content? Get in touch with us directly. Alternatively, email editorial-team (at) simplywallst.com.
This article by Simply Wall St is general in nature. We provide commentary based on historical data and analyst forecasts only using an unbiased methodology and our articles are not intended to be financial advice. It does not constitute a recommendation to buy or sell any stock, and does not take account of your objectives, or your financial situation. We aim to bring you long-term focused analysis driven by fundamental data. Note that our analysis may not factor in the latest price-sensitive company announcements or qualitative material. Simply Wall St has no position in any stocks mentioned.
Join A Paid User Research Session
You’ll receive a US$30 Amazon Gift card for 1 hour of your time while helping us build better investing tools for the individual investors like yourself. Sign up here
