
 Yahoo Finance
 Is FBL Financial Group, Inc. (NYSE:FFG) A Smart Pick For Income Investors?

Today we'll take a closer look at FBL Financial Group, Inc. (NYSE:FFG) from a dividend investor's perspective. Owning a strong business and reinvesting the dividends is widely seen as an attractive way of growing your wealth. On the other hand, investors have been known to buy a stock because of its yield, and then lose money if the company's dividend doesn't live up to expectations.
With FBL Financial Group yielding 5.9% and having paid a dividend for over 10 years, many investors likely find the company quite interesting. We'd guess that plenty of investors have purchased it for the income. The company also bought back stock during the year, equivalent to approximately 0.8% of the company's market capitalisation at the time. Some simple analysis can reduce the risk of holding FBL Financial Group for its dividend, and we'll focus on the most important aspects below.
Click the interactive chart for our full dividend analysis
Payout ratios
Dividends are typically paid from company earnings. If a company pays more in dividends than it earned, then the dividend might become unsustainable - hardly an ideal situation. As a result, we should always investigate whether a company can afford its dividend, measured as a percentage of a company's net income after tax. In the last year, FBL Financial Group paid out 45% of its profit as dividends. This is a middling range that strikes a nice balance between paying dividends to shareholders, and retaining enough earnings to invest in future growth. One of the risks is that management reinvests the retained capital poorly instead of paying a higher dividend.
We update our data on FBL Financial Group every 24 hours, so you can always get our latest analysis of its financial health, here.
Dividend Volatility
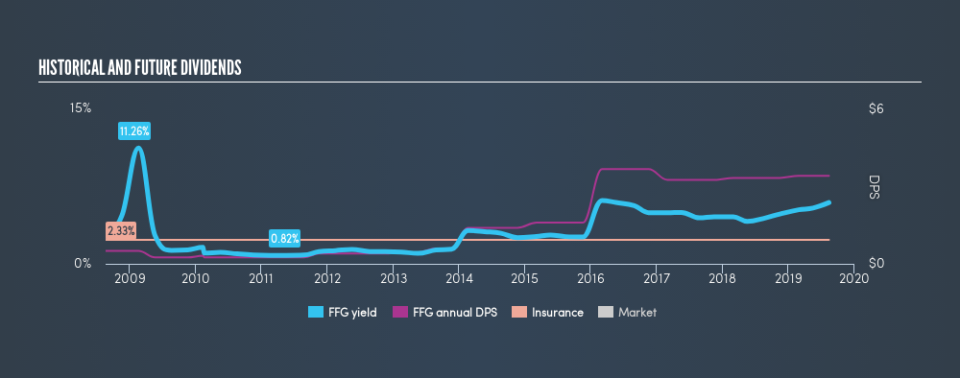
From the perspective of an income investor who wants to earn dividends for many years, there is not much point buying a stock if its dividend is regularly cut or is not reliable. FBL Financial Group has been paying dividends for a long time, but for the purpose of this analysis, we only examine the past 10 years of payments. The dividend has been cut by more than 20% on at least one occasion historically. During the past ten-year period, the first annual payment was US$0.50 in 2009, compared to US$3.42 last year. Dividends per share have grown at approximately 21% per year over this time. The growth in dividends has not been linear, but the CAGR is a decent approximation of the rate of change over this time frame.
It's not great to see that the payment has been cut in the past. We're generally more wary of companies that have cut their dividend before, as they tend to perform worse in an economic downturn.
Dividend Growth Potential
With a relatively unstable dividend, it's even more important to evaluate if earnings per share (EPS) are growing - it's not worth taking the risk on a dividend getting cut, unless you might be rewarded with larger dividends in future. FBL Financial Group's earnings per share have been essentially flat over the past five years. Flat earnings per share are acceptable for a time, but over the long term, the purchasing power of the company's dividends could be eroded by inflation.
Conclusion
Dividend investors should always want to know if a) a company's dividends are affordable, b) if there is a track record of consistent payments, and c) if the dividend is capable of growing. We're glad to see FBL Financial Group has a low payout ratio, as this suggests earnings are being reinvested in the business. Second, earnings per share have been essentially flat, and its history of dividend payments is chequered - having cut its dividend at least once in the past. While we're not hugely bearish on it, overall we think there are potentially better dividend stocks than FBL Financial Group out there.
Now, if you want to look closer, it would be worth checking out our free research on FBL Financial Group management tenure, salary, and performance.
We have also put together a list of global stocks with a market capitalisation above $1bn and yielding more 3%.
We aim to bring you long-term focused research analysis driven by fundamental data. Note that our analysis may not factor in the latest price-sensitive company announcements or qualitative material.
If you spot an error that warrants correction, please contact the editor at editorial-team@simplywallst.com. This article by Simply Wall St is general in nature. It does not constitute a recommendation to buy or sell any stock, and does not take account of your objectives, or your financial situation. Simply Wall St has no position in the stocks mentioned. Thank you for reading.
