
 Yahoo Finance
 Update: FBL Financial Group (NYSE:FFG) Stock Gained 21% In The Last Five Years

While FBL Financial Group, Inc. (NYSE:FFG) shareholders are probably generally happy, the stock hasn't had particularly good run recently, with the share price falling 11% in the last quarter. On the bright side the share price is up over the last half decade. Unfortunately its return of 21% is below the market return of 66%. Unfortunately not all shareholders will have held it for the long term, so spare a thought for those caught in the 21% decline over the last twelve months.
Check out our latest analysis for FBL Financial Group
While the efficient markets hypothesis continues to be taught by some, it has been proven that markets are over-reactive dynamic systems, and investors are not always rational. One flawed but reasonable way to assess how sentiment around a company has changed is to compare the earnings per share (EPS) with the share price.
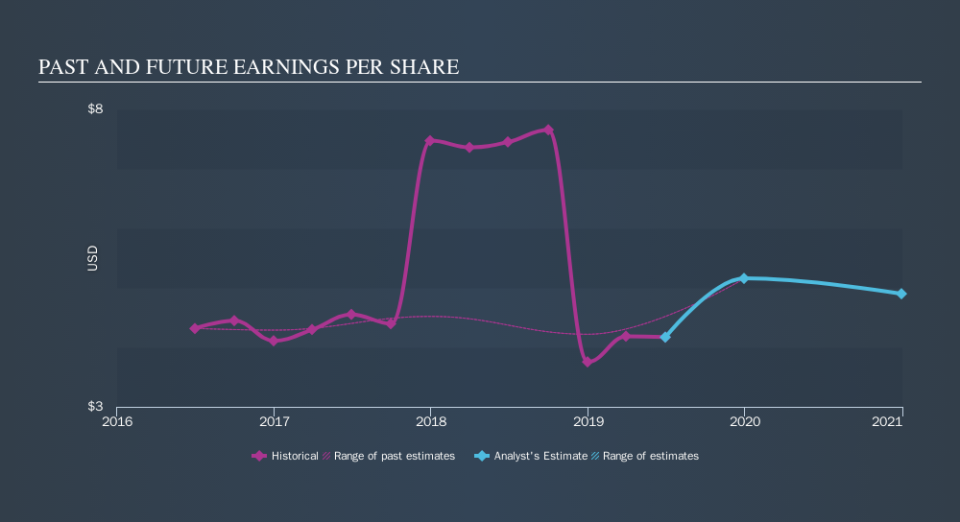
FBL Financial Group's earnings per share are down 0.1% per year, despite strong share price performance over five years.
Since EPS is down a bit, and the share price is up, it's probably that the market previously had some concerns about the company, but the reality has been better than feared. Having said that, if the EPS falls continue we'd be surprised to see a sustained increase in share price.
The image below shows how EPS has tracked over time (if you click on the image you can see greater detail).
Before buying or selling a stock, we always recommend a close examination of historic growth trends, available here..
What About Dividends?
It is important to consider the total shareholder return, as well as the share price return, for any given stock. The TSR is a return calculation that accounts for the value of cash dividends (assuming that any dividend received was reinvested) and the calculated value of any discounted capital raisings and spin-offs. It's fair to say that the TSR gives a more complete picture for stocks that pay a dividend. As it happens, FBL Financial Group's TSR for the last 5 years was 58%, which exceeds the share price return mentioned earlier. The dividends paid by the company have thusly boosted the total shareholder return.
A Different Perspective
Investors in FBL Financial Group had a tough year, with a total loss of 17% (including dividends) , against a market gain of about 8.3%. However, keep in mind that even the best stocks will sometimes underperform the market over a twelve month period. On the bright side, long term shareholders have made money, with a gain of 9.5% per year over half a decade. It could be that the recent sell-off is an opportunity, so it may be worth checking the fundamental data for signs of a long term growth trend. Before forming an opinion on FBL Financial Group you might want to consider the cold hard cash it pays as a dividend. This free chart tracks its dividend over time.
We will like FBL Financial Group better if we see some big insider buys. While we wait, check out this free list of growing companies with considerable, recent, insider buying.
Please note, the market returns quoted in this article reflect the market weighted average returns of stocks that currently trade on US exchanges.
We aim to bring you long-term focused research analysis driven by fundamental data. Note that our analysis may not factor in the latest price-sensitive company announcements or qualitative material.
If you spot an error that warrants correction, please contact the editor at editorial-team@simplywallst.com. This article by Simply Wall St is general in nature. It does not constitute a recommendation to buy or sell any stock, and does not take account of your objectives, or your financial situation. Simply Wall St has no position in the stocks mentioned. Thank you for reading.
