
 Yahoo Finance
 Should You Like FDM Group (Holdings) plc’s (LON:FDM) High Return On Capital Employed?

Today we’ll look at FDM Group (Holdings) plc (LON:FDM) and reflect on its potential as an investment. Specifically, we’ll consider its Return On Capital Employed (ROCE), since that will give us an insight into how efficiently the business can generate profits from the capital it requires.
First up, we’ll look at what ROCE is and how we calculate it. Second, we’ll look at its ROCE compared to similar companies. And finally, we’ll look at how its current liabilities are impacting its ROCE.
Understanding Return On Capital Employed (ROCE)
ROCE is a metric for evaluating how much pre-tax income (in percentage terms) a company earns on the capital invested in its business. All else being equal, a better business will have a higher ROCE. In brief, it is a useful tool, but it is not without drawbacks. Author Edwin Whiting says to be careful when comparing the ROCE of different businesses, since ‘No two businesses are exactly alike.’
How Do You Calculate Return On Capital Employed?
Analysts use this formula to calculate return on capital employed:
Return on Capital Employed = Earnings Before Interest and Tax (EBIT) ÷ (Total Assets – Current Liabilities)
Or for FDM Group (Holdings):
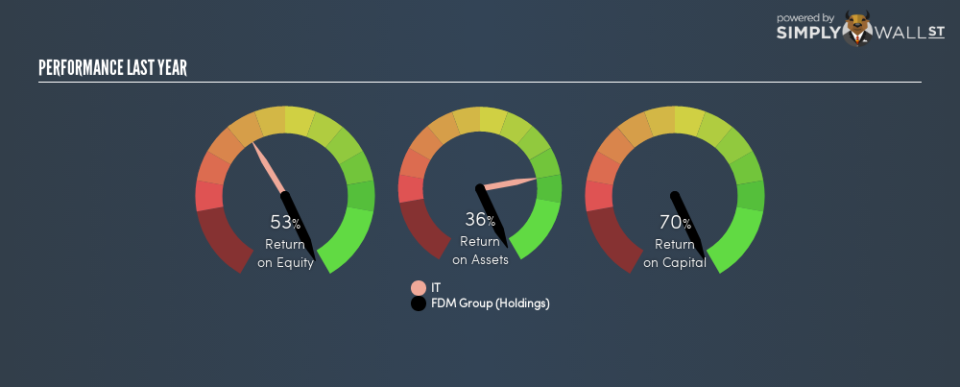
0.70 = UK£44m ÷ (UK£97m – UK£31m) (Based on the trailing twelve months to June 2018.)
Therefore, FDM Group (Holdings) has an ROCE of 70%.
View our latest analysis for FDM Group (Holdings)
Want to help shape the future of investing tools and platforms? Take the survey and be part of one of the most advanced studies of stock market investors to date.
Does FDM Group (Holdings) Have A Good ROCE?
ROCE can be useful when making comparisons, such as between similar companies. In our analysis, FDM Group (Holdings)’s ROCE is meaningfully higher than the 11% average in the IT industry. We would consider this a positive, as it suggests it is using capital more effectively than other similar companies. Putting aside its position relative to its industry for now, in absolute terms, FDM Group (Holdings)’s ROCE is currently very good.
Remember that this metric is backwards looking – it shows what has happened in the past, and does not accurately predict the future. Companies in cyclical industries can be difficult to understand using ROCE, as returns typically look high during boom times, and low during busts. ROCE is only a point-in-time measure. What happens in the future is pretty important for investors, so we have prepared a free report on analyst forecasts for FDM Group (Holdings).
Do FDM Group (Holdings)’s Current Liabilities Skew Its ROCE?
Liabilities, such as supplier bills and bank overdrafts, are referred to as current liabilities if they need to be paid within 12 months. Due to the way the ROCE equation works, having large bills due in the near term can make it look as though a company has less capital employed, and thus a higher ROCE than usual. To counteract this, we check if a company has high current liabilities, relative to its total assets.
FDM Group (Holdings) has total liabilities of UK£31m and total assets of UK£97m. As a result, its current liabilities are equal to approximately 32% of its total assets. A medium level of current liabilities boosts FDM Group (Holdings)’s ROCE somewhat.
What We Can Learn From FDM Group (Holdings)’s ROCE
Despite this, it reports a high ROCE, and may be worth investigating further. You might be able to find a better buy than FDM Group (Holdings). If you want a selection of possible winners, check out this free list of interesting companies that trade on a P/E below 20 (but have proven they can grow earnings).
I will like FDM Group (Holdings) better if I see some big insider buys. While we wait, check out this free list of growing companies with considerable, recent, insider buying.
To help readers see past the short term volatility of the financial market, we aim to bring you a long-term focused research analysis purely driven by fundamental data. Note that our analysis does not factor in the latest price-sensitive company announcements.
The author is an independent contributor and at the time of publication had no position in the stocks mentioned. For errors that warrant correction please contact the editor at editorial-team@simplywallst.com.
