
 Yahoo Finance
 Ferro-Alloy Resources (LON:FAR) shareholders have endured a 53% loss from investing in the stock a year ago
While not a mind-blowing move, it is good to see that the Ferro-Alloy Resources Limited (LON:FAR) share price has gained 11% in the last three months. But that doesn't change the fact that the returns over the last year have been disappointing. Like an arid lake in a warming world, shareholder value has evaporated, with the share price down 53% in that time. The share price recovery is not so impressive when you consider the fall. It may be that the fall was an overreaction.
Now let's have a look at the company's fundamentals, and see if the long term shareholder return has matched the performance of the underlying business.
See our latest analysis for Ferro-Alloy Resources
Given that Ferro-Alloy Resources didn't make a profit in the last twelve months, we'll focus on revenue growth to form a quick view of its business development. Shareholders of unprofitable companies usually expect strong revenue growth. That's because fast revenue growth can be easily extrapolated to forecast profits, often of considerable size.
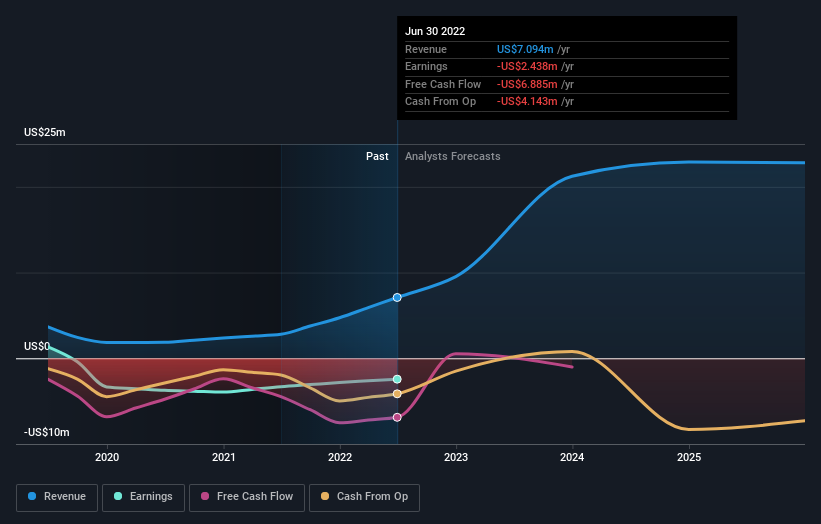
In the last twelve months, Ferro-Alloy Resources increased its revenue by 154%. That's a strong result which is better than most other loss making companies. Meanwhile, the share price slid 53%. Typically a growth stock like this will be volatile, with some shareholders concerned about the red ink on the bottom line (that is, the losses). We'd definitely consider it a positive if the company is trending towards profitability. If you can see that happening, then perhaps consider adding this stock to your watchlist.
The graphic below depicts how earnings and revenue have changed over time (unveil the exact values by clicking on the image).
If you are thinking of buying or selling Ferro-Alloy Resources stock, you should check out this FREE detailed report on its balance sheet.
A Different Perspective
Ferro-Alloy Resources shareholders are down 53% for the year, falling short of the market return. Meanwhile, the broader market slid about 3.5%, likely weighing on the stock. Shareholders have lost 4% per year over the last three years, so the share price drop has become steeper, over the last year; a potential symptom of as yet unsolved challenges. We would be wary of buying into a company with unsolved problems, although some investors will buy into struggling stocks if they believe the price is sufficiently attractive. While it is well worth considering the different impacts that market conditions can have on the share price, there are other factors that are even more important. Take risks, for example - Ferro-Alloy Resources has 5 warning signs (and 3 which are significant) we think you should know about.
If you like to buy stocks alongside management, then you might just love this free list of companies. (Hint: insiders have been buying them).
Please note, the market returns quoted in this article reflect the market weighted average returns of stocks that currently trade on GB exchanges.
Have feedback on this article? Concerned about the content? Get in touch with us directly. Alternatively, email editorial-team (at) simplywallst.com.
This article by Simply Wall St is general in nature. We provide commentary based on historical data and analyst forecasts only using an unbiased methodology and our articles are not intended to be financial advice. It does not constitute a recommendation to buy or sell any stock, and does not take account of your objectives, or your financial situation. We aim to bring you long-term focused analysis driven by fundamental data. Note that our analysis may not factor in the latest price-sensitive company announcements or qualitative material. Simply Wall St has no position in any stocks mentioned.
Join A Paid User Research Session
You’ll receive a US$30 Amazon Gift card for 1 hour of your time while helping us build better investing tools for the individual investors like yourself. Sign up here
