
 Yahoo Finance
 Is Ferrovial SA.’s (BME:FER) Balance Sheet A Threat To Its Future?

The size of Ferrovial SA. (BME:FER), a €12.54B large-cap, often attracts investors seeking a reliable investment in the stock market. Doing business globally, large caps tend to have diversified revenue streams and attractive capital returns, making them desirable investments for risk-averse portfolios. But, the key to their continued success lies in its financial health. I will provide an overview of Ferrovial’s financial liquidity and leverage to give you an idea of Ferrovial’s position to take advantage of potential acquisitions or comfortably endure future downturns. Remember this is a very top-level look that focuses exclusively on financial health, so I recommend a deeper analysis into FER here. See our latest analysis for Ferrovial
Does FER produce enough cash relative to debt?
FER has sustained its debt level by about €8.51B over the last 12 months comprising of short- and long-term debt. At this constant level of debt, the current cash and short-term investment levels stands at €4.54B , ready to deploy into the business. On top of this, FER has generated cash from operations of €1.28B during the same period of time, resulting in an operating cash to total debt ratio of 15.05%, signalling that FER’s current level of operating cash is not high enough to cover debt. This ratio can also be a sign of operational efficiency as an alternative to return on assets. In FER’s case, it is able to generate 0.15x cash from its debt capital.
Can FER pay its short-term liabilities?
With current liabilities at €5.85B, it seems that the business has been able to meet these obligations given the level of current assets of €8.06B, with a current ratio of 1.38x. Generally, for Construction companies, this is a reasonable ratio since there’s sufficient cash cushion without leaving too much capital idle or in low-earning investments.
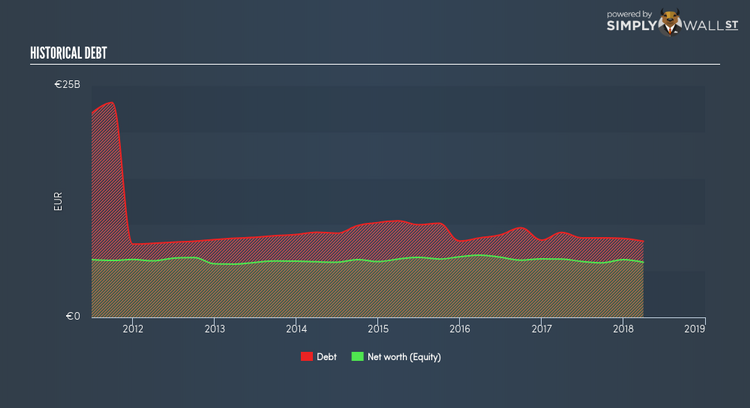
Is FER’s debt level acceptable?
Ferrovial is a highly levered company given that total debt exceeds equity. This isn’t uncommon for large companies because interest payments on debt are tax deductible, meaning debt can be a cheaper source of capital than equity. Accordingly, large companies often have an advantage over small-caps through lower cost of capital due to cheaper financing. We can test if FER’s debt levels are sustainable by measuring interest payments against earnings of a company. A company generating earnings after interest and tax at least three times its net interest payments is considered financially sound. In FER’s case, the ratio of 1.04x suggests that interest is not strongly covered. Given the sheer size of Ferrovial, it’s unlikely to default on interest payments and enter bankruptcy. However, compared to an amply profitable large-cap peer, debtors may see more risk in lending to FER.
Next Steps:
At its current level of cash flow coverage, FER has room for improvement to better cushion for events which may require debt repayment. However, the company exhibits an ability to meet its near-term obligations, which isn’t a big surprise for a large-cap. I admit this is a fairly basic analysis for FER’s financial health. Other important fundamentals need to be considered alongside. I recommend you continue to research Ferrovial to get a more holistic view of the stock by looking at:
Future Outlook: What are well-informed industry analysts predicting for FER’s future growth? Take a look at our free research report of analyst consensus for FER’s outlook.
Valuation: What is FER worth today? Is the stock undervalued, even when its growth outlook is factored into its intrinsic value? The intrinsic value infographic in our free research report helps visualize whether FER is currently mispriced by the market.
Other High-Performing Stocks: Are there other stocks that provide better prospects with proven track records? Explore our free list of these great stocks here.
To help readers see pass the short term volatility of the financial market, we aim to bring you a long-term focused research analysis purely driven by fundamental data. Note that our analysis does not factor in the latest price sensitive company announcements.
The author is an independent contributor and at the time of publication had no position in the stocks mentioned.
