
 Yahoo Finance
 Is FFI Holdings PLC’s (LON:FFI) Balance Sheet A Threat To Its Future?

FFI Holdings PLC (AIM:FFI) is a small-cap stock with a market capitalization of UK£127.20M. While investors primarily focus on the growth potential and competitive landscape of the small-cap companies, they end up ignoring a key aspect, which could be the biggest threat to its existence: its financial health. Why is it important? Given that FFI is not presently profitable, it’s crucial to understand the current state of its operations and pathway to profitability. I believe these basic checks tell most of the story you need to know. However, I know these factors are very high-level, so I suggest you dig deeper yourself into FFI here.
How does FFI’s operating cash flow stack up against its debt?
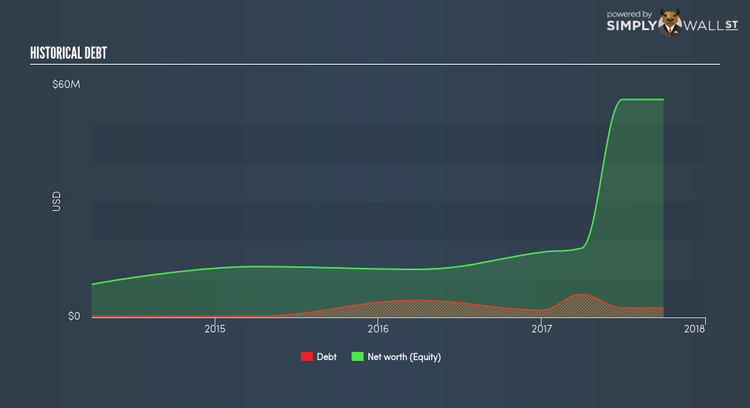
FFI’s debt levels surged from US$4.41M to US$5.96M over the last 12 months , which comprises of short- and long-term debt. With this growth in debt, FFI currently has US$13.15M remaining in cash and short-term investments , ready to deploy into the business. Moreover, FFI has produced cash from operations of US$6.73M during the same period of time, leading to an operating cash to total debt ratio of 112.96%, indicating that FFI’s operating cash is sufficient to cover its debt. This ratio can also be interpreted as a measure of efficiency for unprofitable companies since metrics such as return on asset (ROA) requires a positive net income. In FFI’s case, it is able to generate 1.13x cash from its debt capital.
Does FFI’s liquid assets cover its short-term commitments?
Looking at FFI’s most recent US$65.44M liabilities, it seems that the business has maintained a safe level of current assets to meet its obligations, with the current ratio last standing at 1.08x. Usually, for Media companies, this is a suitable ratio since there is a bit of a cash buffer without leaving too much capital in a low-return environment.
Is FFI’s debt level acceptable?
With a debt-to-equity ratio of 4.33%, FFI’s debt level is relatively low. FFI is not taking on too much debt commitment, which may be constraining for future growth. FFI’s risk around capital structure is almost non-existent, and the company has the headroom and ability to raise debt should it need to in the future.
Next Steps:
FFI’s high cash coverage and low debt levels indicate its ability to utilise its borrowings efficiently in order to generate ample cash flow. Furthermore, the company exhibits an ability to meet its near term obligations should an adverse event occur. I admit this is a fairly basic analysis for FFI’s financial health. Other important fundamentals need to be considered alongside. I suggest you continue to research FFI Holdings to get a better picture of the stock by looking at:
Valuation: What is FFI worth today? Is the stock undervalued, even when its growth outlook is factored into its intrinsic value? The intrinsic value infographic in our free research report helps visualize whether FFI is currently mispriced by the market.
Historical Performance: What has FFI’s returns been like over the past? Go into more detail in the past track record analysis and take a look at the free visual representations of our analysis for more clarity.
Other High-Performing Stocks: Are there other stocks that provide better prospects with proven track records? Explore our free list of these great stocks here.
To help readers see pass the short term volatility of the financial market, we aim to bring you a long-term focused research analysis purely driven by fundamental data. Note that our analysis does not factor in the latest price sensitive company announcements.
The author is an independent contributor and at the time of publication had no position in the stocks mentioned.
