
 Yahoo Finance
 Should Fidessa group plc’s (LON:FDSA) Recent Earnings Worry You?

When Fidessa group plc (LON:FDSA) released its most recent earnings update (31 December 2017), I compared it against two factor: its historical earnings track record, and the performance of its industry peers on average. Being able to interpret how well Fidessa group has done so far requires weighing its performance against a benchmark, rather than looking at a standalone number at a point in time. In this article, I’ve summarized the key takeaways on how I see FDSA has performed. See our latest analysis for Fidessa group
Did FDSA perform better than its track record and industry?
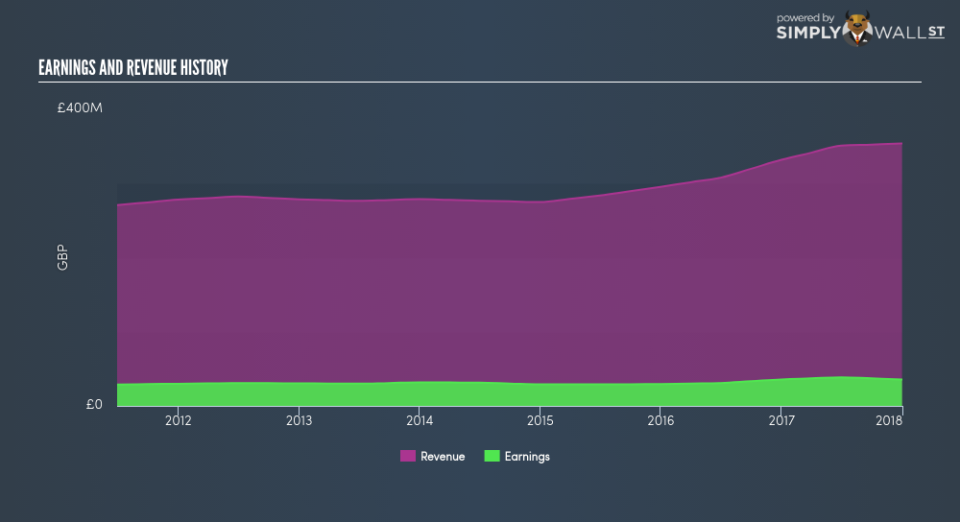
FDSA’s trailing twelve-month earnings (from 31 December 2017) of UK£35.68m has declined by -0.20% compared to the previous year. Furthermore, this one-year growth rate has been lower than its average earnings growth rate over the past 5 years of 3.07%, indicating the rate at which FDSA is growing has slowed down. Why is this? Let’s examine what’s transpiring with margins and whether the entire industry is feeling the heat.
Revenue growth in the last couple of years, has been positive, however, earnings growth has fallen behind meaning Fidessa group has been increasing its expenses by a lot more. This hurts margins and earnings, and is not a sustainable practice. Scanning growth from a sector-level, the UK software industry has been growing its average earnings by double-digit 19.42% over the previous year, and 15.27% over the past five. This means whatever uplift the industry is profiting from, Fidessa group has not been able to gain as much as its average peer.
In terms of returns from investment, Fidessa group has invested its equity funds well leading to a 21.40% return on equity (ROE), above the sensible minimum of 20%. Furthermore, its return on assets (ROA) of 11.27% exceeds the GB Software industry of 7.83%, indicating Fidessa group has used its assets more efficiently. And finally, its return on capital (ROC), which also accounts for Fidessa group’s debt level, has increased over the past 3 years from 23.24% to 28.91%.
What does this mean?
Fidessa group’s track record can be a valuable insight into its earnings performance, but it certainly doesn’t tell the whole story. Companies that are profitable, but have unpredictable earnings, can have many factors impacting its business. I recommend you continue to research Fidessa group to get a more holistic view of the stock by looking at:
Future Outlook: What are well-informed industry analysts predicting for FDSA’s future growth? Take a look at our free research report of analyst consensus for FDSA’s outlook.
Financial Health: Is FDSA’s operations financially sustainable? Balance sheets can be hard to analyze, which is why we’ve done it for you. Check out our financial health checks here.
Other High-Performing Stocks: Are there other stocks that provide better prospects with proven track records? Explore our free list of these great stocks here.
NB: Figures in this article are calculated using data from the trailing twelve months from 31 December 2017. This may not be consistent with full year annual report figures.
To help readers see pass the short term volatility of the financial market, we aim to bring you a long-term focused research analysis purely driven by fundamental data. Note that our analysis does not factor in the latest price sensitive company announcements.
The author is an independent contributor and at the time of publication had no position in the stocks mentioned.
