
 Yahoo Finance
 Fielmann Group (ETR:FIE) Might Be Having Difficulty Using Its Capital Effectively
If you're looking for a multi-bagger, there's a few things to keep an eye out for. Firstly, we'll want to see a proven return on capital employed (ROCE) that is increasing, and secondly, an expanding base of capital employed. Basically this means that a company has profitable initiatives that it can continue to reinvest in, which is a trait of a compounding machine. Having said that, from a first glance at Fielmann Group (ETR:FIE) we aren't jumping out of our chairs at how returns are trending, but let's have a deeper look.
What Is Return On Capital Employed (ROCE)?
If you haven't worked with ROCE before, it measures the 'return' (pre-tax profit) a company generates from capital employed in its business. The formula for this calculation on Fielmann Group is:
Return on Capital Employed = Earnings Before Interest and Tax (EBIT) ÷ (Total Assets - Current Liabilities)
0.15 = €205m ÷ (€1.8b - €417m) (Based on the trailing twelve months to September 2023).
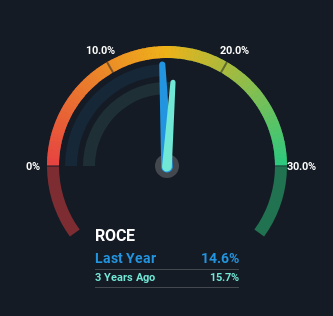
Thus, Fielmann Group has an ROCE of 15%. On its own, that's a standard return, however it's much better than the 5.0% generated by the Specialty Retail industry.
Check out our latest analysis for Fielmann Group
In the above chart we have measured Fielmann Group's prior ROCE against its prior performance, but the future is arguably more important. If you're interested, you can view the analysts predictions in our free analyst report for Fielmann Group .
The Trend Of ROCE
In terms of Fielmann Group's historical ROCE movements, the trend isn't fantastic. Over the last five years, returns on capital have decreased to 15% from 31% five years ago. Although, given both revenue and the amount of assets employed in the business have increased, it could suggest the company is investing in growth, and the extra capital has led to a short-term reduction in ROCE. If these investments prove successful, this can bode very well for long term stock performance.
In Conclusion...
In summary, despite lower returns in the short term, we're encouraged to see that Fielmann Group is reinvesting for growth and has higher sales as a result. And there could be an opportunity here if other metrics look good too, because the stock has declined 23% in the last five years. So we think it'd be worthwhile to look further into this stock given the trends look encouraging.
One more thing to note, we've identified 1 warning sign with Fielmann Group and understanding this should be part of your investment process.
While Fielmann Group isn't earning the highest return, check out this free list of companies that are earning high returns on equity with solid balance sheets.
Have feedback on this article? Concerned about the content? Get in touch with us directly. Alternatively, email editorial-team (at) simplywallst.com.
This article by Simply Wall St is general in nature. We provide commentary based on historical data and analyst forecasts only using an unbiased methodology and our articles are not intended to be financial advice. It does not constitute a recommendation to buy or sell any stock, and does not take account of your objectives, or your financial situation. We aim to bring you long-term focused analysis driven by fundamental data. Note that our analysis may not factor in the latest price-sensitive company announcements or qualitative material. Simply Wall St has no position in any stocks mentioned.
