
 Yahoo Finance
 Fifth Third (FITB) Q2 Earnings Beat Estimates, Costs Escalate
Fifth Third Bancorp FITB reported second-quarter 2021 adjusted earnings of 94 cents per share, beating the Zacks Consensus Estimate of 83 cents. Results also compare favorably with the prior-year quarter’s earnings of 23 cents per share.
The company’s performance highlights a solid capital position, with rising revenues, aided by fee income. Also, benefit from credit losses was a tailwind. However, marginally higher expenses and muted loan growth played spoilsport.
The company reported net income available to common shareholders of $674 million or 95 cents per share compared with the $163 million or 23 cents witnessed in the prior-year quarter.
Revenues & Non-Interest Income Rise, Costs Flare Up, Loans Flat
Total adjusted revenues for the reported quarter came in at $1.95 billion, up 5.3% year over year, driven by higher fee and net interest income. Further, the top-line figure surpassed the Zacks Consensus Estimate of $1.94 billion.
Fifth Third’s net interest income (tax equivalent) came in at $1.21 billion, up marginally year on year. It primarily reflects lower deposit costs, the impact of the GNMA loan buyout purchases, interest income from PPP loans, and a reduction in long-term debt, partially offset by lower C&I loan balances. Net interest margin shrunk 12 basis points (bps), year over year, to 2.63%, representing the impact of excess liquidity.
Non-interest income climbed 14.6% year over year to $768 million (excluding certain non-recurring items). Including significant items, non-interest income increased 14% year over year to $741 million. Rise in service charges on deposits, wealth and asset management revenues, card and processing revenues, leasing business revenues and other non-interest revenues were partly negated by lower net security gains.
Excluding merger-related expenses, non-interest expenses flared up 4.3% from the prior-year quarter to $1.15 billion. This upsurge chiefly resulted from rise in performance-based compensation expense, underlining solid business results and higher other non-interest expense, including the expenses associated with the GNMA loan buyout purchases, partially offset by lower card and processing expense and lower net occupancy expense. Including merger expenses, costs flared up 3% year over year.
As of Jun 30, 2021, average loan and lease balances and average total deposits at $108.5 billion and $162.6 billion, respectively. Loans remained flat as an increase in consumer loans was offset by a decrease in commercial loan and lease balances. A 3% sequential rise in deposits was driven by increases in consumer and commercial deposit balances across most product types, benefiting from continued fiscal and monetary stimulus, offset by a decrease in other time balances to some extent.
Credit Quality Improved
The company reported benefit from credit losses of $115 million compared with the provisions of $485 million in the year-ago quarter. Net charge-offs for the second quarter came in at $44 million or 16 bps of average loans and leases on an annualized basis compared with the $47 million or 44 bps witnessed in the prior-year quarter.
Further, total allowance for credit losses decreased 23% to $2.22 billion from the prior-year quarter. Total non-performing assets, including loans held for sale, came in at $697 million, down7% from the year-ago quarter.
Strong Capital Position
Fifth Third was well capitalized during the April-June period. The Tier 1 risk-based capital ratio was 11.83% compared with the 10.96% posted at the end of the prior-year quarter. The CET1 capital ratio (fully phased-in) was 10.37% as against the 9.72% recorded at the end of the year-ago quarter. The Tier 1 leverage ratio was 8.55% compared with the year-earlier quarter’s 8.16%.
Our Viewpoint
We believe Fifth Third, with a diversified traditional banking platform, is well poised to benefit from recovery in the economies where it has a footprint. The bank’s steady improvement in loans and deposits highlights its efficient organic growth strategy.
Though the company’s focus on several strategic initiatives to boost performance is a positive, several concerns, including escalating expenses and low rates, prevail.
Fifth Third Bancorp Price, Consensus and EPS Surprise
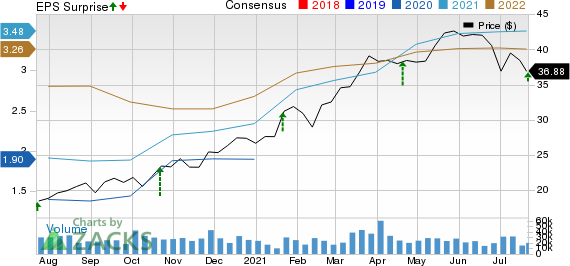
Fifth Third Bancorp price-consensus-eps-surprise-chart | Fifth Third Bancorp Quote
Currently, Fifth Third carries a Zacks Rank #3 (Hold). You can see the complete list of today’s Zacks #1 Rank (Strong Buy) stocks here.
Performance of Other Banks
Bank of America’s BAC second-quarter 2021 earnings of $1.03 per share handily beat the Zacks Consensus Estimate of 77 cents. The bottom line compared favorably with the 37 cents earned in the prior-year quarter.
PNC Financial PNC delivered second-quarter 2021 earnings surprise of 42.4% on substantial reserve release. Adjusted earnings per share of $4.50 surpassed the Zacks Consensus Estimate of $3.16.
Large reserve releases, solid investment banking performance and modest rise in loan demand drove JPMorgan’s JPM second-quarter 2021 earnings of $3.78 per share. The bottom line comfortably outpaced the Zacks Consensus Estimate of $3.05.
Want the latest recommendations from Zacks Investment Research? Today, you can download 7 Best Stocks for the Next 30 Days. Click to get this free report
Bank of America Corporation (BAC) : Free Stock Analysis Report
JPMorgan Chase & Co. (JPM) : Free Stock Analysis Report
Fifth Third Bancorp (FITB) : Free Stock Analysis Report
The PNC Financial Services Group, Inc (PNC) : Free Stock Analysis Report
To read this article on Zacks.com click here.
Zacks Investment Research
