
 Yahoo Finance
 How Financially Strong Is BCE Inc (TSE:BCE)?

Investors pursuing a solid, dependable stock investment can often be led to BCE Inc (TSX:BCE), a large-cap worth CA$49.07B. Big corporations are much sought after by risk-averse investors who find diversified revenue streams and strong capital returns attractive. However, the key to extending previous success is in the health of the company’s financials. Today we will look at BCE’s financial liquidity and debt levels, which are strong indicators for whether the company can weather economic downturns or fund strategic acquisitions for future growth. Note that this commentary is very high-level and solely focused on financial health, so I suggest you dig deeper yourself into BCE here. View our latest analysis for BCE
Does BCE produce enough cash relative to debt?
BCE’s debt levels surged from CA$21.46B to CA$23.39B over the last 12 months – this includes both the current and long-term debt. With this growth in debt, the current cash and short-term investment levels stands at CA$625.00M , ready to deploy into the business. Moreover, BCE has produced CA$7.36B in operating cash flow during the same period of time, leading to an operating cash to total debt ratio of 31.45%, signalling that BCE’s current level of operating cash is high enough to cover debt. This ratio can also be a sign of operational efficiency as an alternative to return on assets. In BCE’s case, it is able to generate 0.31x cash from its debt capital.
Can BCE meet its short-term obligations with the cash in hand?
At the current liabilities level of CA$10.79B liabilities, it seems that the business is not able to meet these obligations given the level of current assets of CA$4.64B, with a current ratio of 0.43x below the prudent level of 3x.
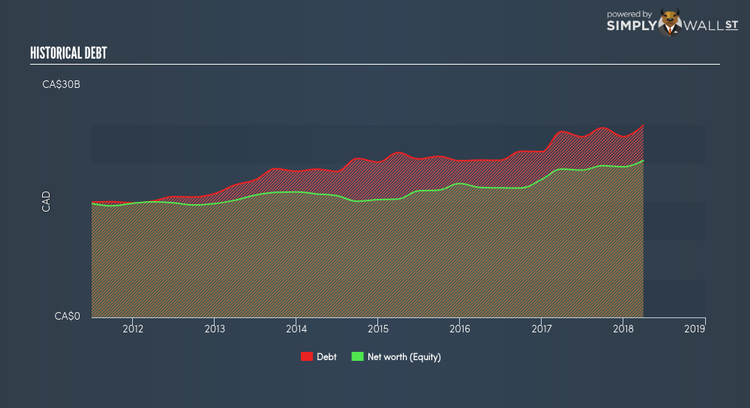
Is BCE’s debt level acceptable?
BCE is a highly levered company given that total debt exceeds equity. This isn’t surprising for large-caps, as equity can often be more expensive to issue than debt, plus interest payments are tax deductible. Accordingly, large companies often have an advantage over small-caps through lower cost of capital due to cheaper financing. We can check to see whether BCE is able to meet its debt obligations by looking at the net interest coverage ratio. Ideally, earnings before interest and tax (EBIT) should cover net interest by at least three times. For BCE, the ratio of 5.48x suggests that interest is well-covered. High interest coverage serves as an indication of the safety of a company, which highlights why many large organisations like BCE are considered a risk-averse investment.
Next Steps:
Although BCE’s debt level is towards the higher end of the spectrum, its cash flow coverage seems adequate to meet debt obligations which means its debt is being efficiently utilised. But, its lack of liquidity raises questions over current asset management practices for the large-cap. Keep in mind I haven’t considered other factors such as how BCE has been performing in the past. I recommend you continue to research BCE to get a better picture of the stock by looking at:
Future Outlook: What are well-informed industry analysts predicting for BCE’s future growth? Take a look at our free research report of analyst consensus for BCE’s outlook.
Valuation: What is BCE worth today? Is the stock undervalued, even when its growth outlook is factored into its intrinsic value? The intrinsic value infographic in our free research report helps visualize whether BCE is currently mispriced by the market.
Other High-Performing Stocks: Are there other stocks that provide better prospects with proven track records? Explore our free list of these great stocks here.
To help readers see pass the short term volatility of the financial market, we aim to bring you a long-term focused research analysis purely driven by fundamental data. Note that our analysis does not factor in the latest price sensitive company announcements.
The author is an independent contributor and at the time of publication had no position in the stocks mentioned.
